Figures & data
Figure 1. (A) Presents two responses to the TSST reflecting significant phase variability (timing) but limited amplitude variability. The observed differences at 15 min and 35 min are likely due primarily to differences in the timing of the response. (B) Shows the same data after adjusting the curves to control for timing differences. Analysis of data would correctly show that the groups do not differ in reactivity or regulation once timing differences are accounted for.
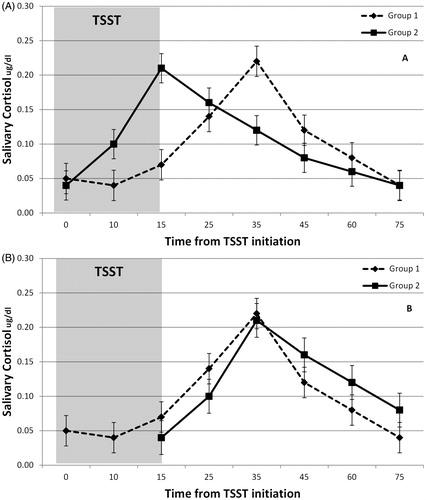
Table 1. Example of database setup in wide format prior to long-transformation.
Table 2. Example of database setup after long-format transformation and creation of adjusted time variables.
Figure 2. ACTH changes in response to TSST for males and females modeled via repeated measures (A) and growth curve modeling (B). Repeated measures results show means and standard errors. Growth curve model shows estimated cubic curves. *Significant comparisons after Bonferroni adjustment.
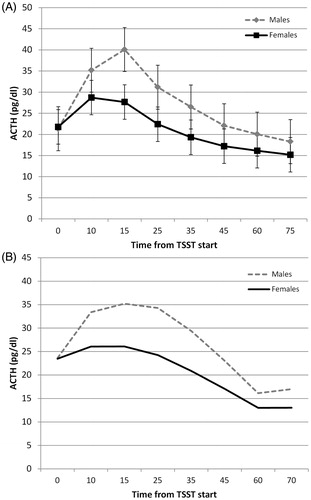
Figure 3. Saliva cortisol changes in response to TSST for males and females modeled via repeated measures (A) and traditional growth curve modeling (B). Repeated measures results show means and standard errors. Growth curve model shows estimated quadratic curves.
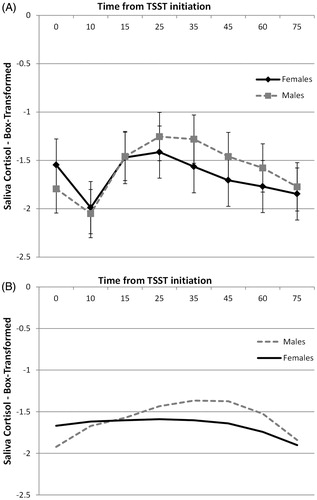
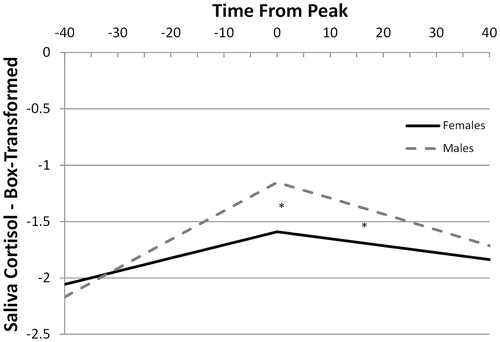
Figure 4. Estimated saliva cortisol slopes before and after post-TSST peak for males and females modeled via growth curve modeling with landmark registered data (common peak). *Significant sex effect on peak and regulation slope, but not on activation slope.