Figures & data
Figure 1. Screenshot of the two different tasks, mental rotation (a) and subtraction task (b), presented in the performance phase of the stress paradigm and (c) the design of the ScanSTRESS paradigm with two runs, preceded by an instruction phase and interrupted by critical verbal feedback given by one panel member to the participant.
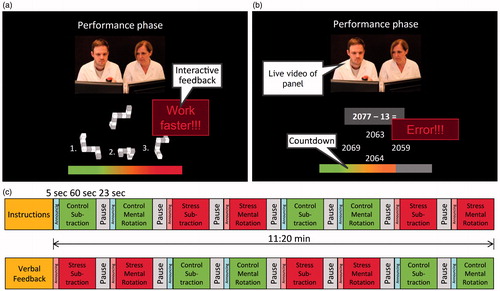
Figure 2. Mean (±SEM) heart rate (in beats per minute) responses to the ScanSTRESS paradigm. Asterisks indicate significant differences between two conditions (p < 0.001, independent t-tests for post-hoc comparison).
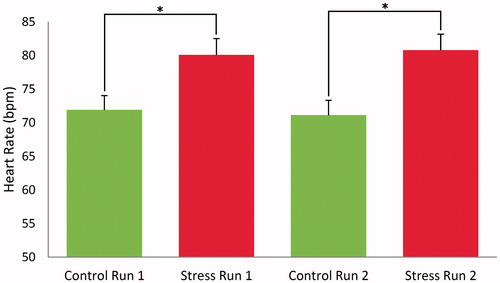
Figure 3. Mean (±SEM) plasma ACTH (a) and salivary cortisol (b) responses to the ScanSTRESS paradigm in responders and non-responders.
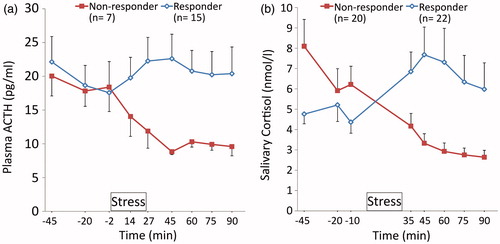
Figure 4. Main effect of social stress induction: activation (a) and deactivation (b). The functional maps are thresholded at a significance threshold of p < 0.05 FWE corrected for multiple comparisons across the whole brain. Neural response included activations in ventral striatum, thalamus, frontoinsular cortex, hippocampus and amygdala and deactivations in rACC (all p < 0.05, whole-brain FWE corrected); FWE = family-wise error corrected for multiple comparisons.
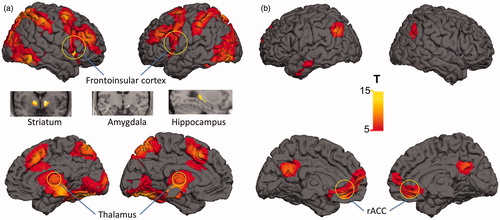
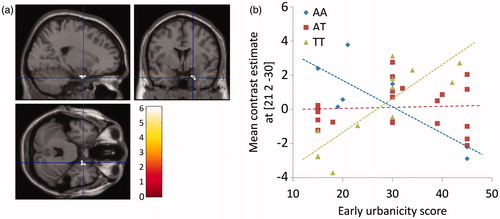
Figure 5. Interaction of early life (birth until age 15) urbanicity scores and genotype of NPSR1 polymorphism rs324981 on amygdala activation under acute psychosocial stress (a and b). (a) T-map of significant correlations between activations in the stress > control contrast with the interaction term for the urban upbringing score and the genotype for rs324981 displayed at a threshold of p < 0.05 FWE whole-brain corrected. (b) Scatterplot of the correlation between the urban upbringing score and the most significant correlated voxel in the right amygdala (located at x = 21, y = 2, z = −30) for the interaction term in the stress > control contrast depicted separately for the three genotype groups of rs324981; FWE = family-wise error corrected for multiple comparisons.