
Figures & data
Figure 1. On the left – Recordings of pulsatile arterial pressure (PAP), mean arterial pressure (MAP), and heart rate (HR) of one unanesthetized rat submitted to restraint showing the cardiovascular changes observed during a restraint period of 60 min. On the right – Curves showing changes with time of differential pressure (systolic – diastolic pressure, ΔDP), mean arterial pressure (ΔMAP) and heart rate (ΔHR). The onset of restraint is at t = 0.
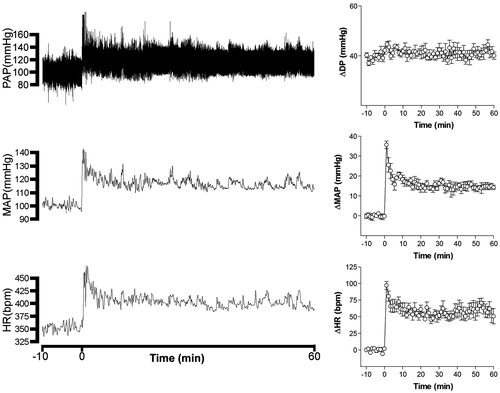
Figure 2. Mean arterial pressure (ΔMAP) and heart rate (ΔHR) changes with time during restraint in the vehicle-treated control group (1 mL/kg, i.v., n = 6) and pentolinium-treated group (5 mg/kg, i.v., n = 6). Drugs were injected at t = −10 min. The onset of restraint is at t = 0. *Significantly different from control. p < 0.05; two-way ANOVA.
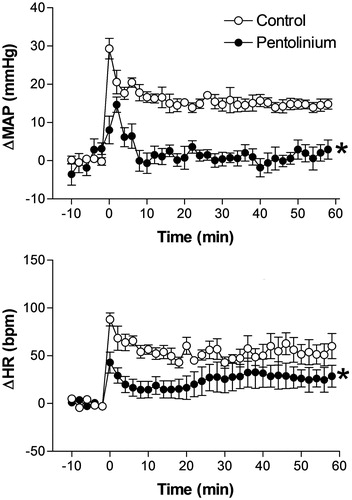
Figure 3. Mean arterial pressure (ΔMAP) and heart rate (ΔHR) changes with time during restraint in the vehicle-treated control group (1 mL/kg, i.v., n = 6), and homatropine-treated group (0.2 mg/kg, i.v., n = 5). Drugs were injected at t = −10 min. The onset of restraint is at t = 0. *Significantly different from control. p < 0.05; two-way ANOVA.
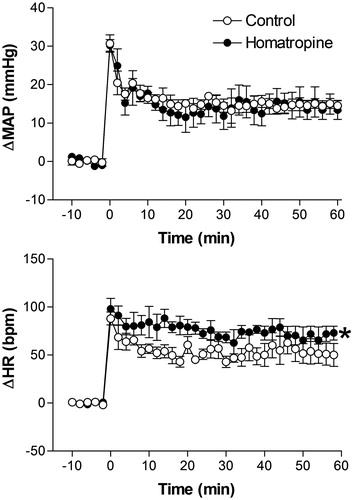
Figure 4. Mean arterial pressure (ΔMAP) and heart rate (ΔHR) changes with time during restraint in the vehicle-treated control group (1 mL/kg, i.v., n = 6), and prazosin-treated group (0.5 mg/kg, i.v., n = 6). Drugs were injected at t = −10 min. The onset of restraint is at t = 0. *Significantly different from control. p < 0.05; two-way ANOVA.
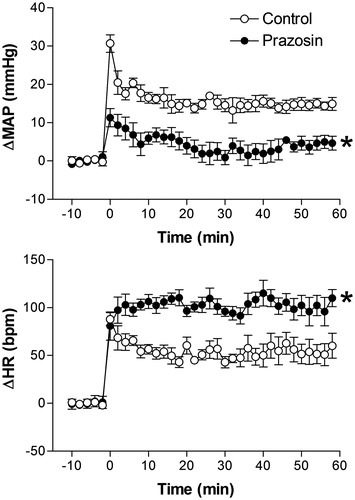
Figure 5. Mean arterial pressure (ΔMAP) and heart rate (ΔHR) changes with time during restraint in the vehicle-treated control group (1 mL/kg, i.v., n = 6), and atenolol-treated group (1 mg/kg, i.v., n = 6). Drugs were injected at t = −10 min. The onset of restraint is at t = 0. *Significantly different from control. p < 0.05; two-way ANOVA.
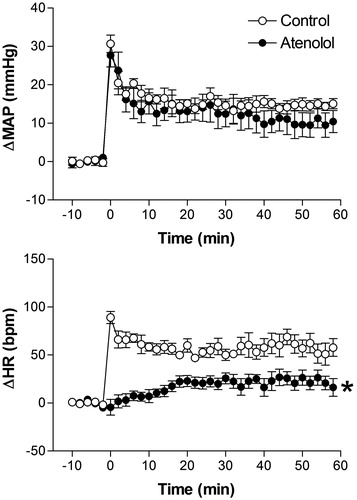
Figure 6. Mean arterial pressure (ΔMAP) and heart rate (ΔHR) changes with time during restraint in the vehicle-treated control group (1 mL/kg, i.v., n = 6), and 0.5 mg/kg prazosin + 1 mg/kg atenolol-treated group (5 mg/kg, i.v., n = 6). Drugs were injected at t = −10 min. The onset of restraint is at t = 0. *Significantly different from control. p < 0.05; two-way ANOVA.
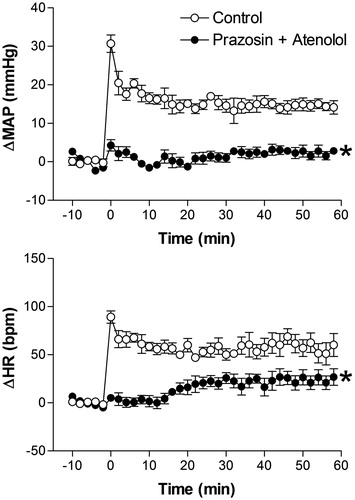
Figure 7. Mean arterial pressure (ΔMAP) and heart rate (ΔHR) changes with time during restraint in the sham-operated group (n = 6) and adrenal desmedullated group (n = 6). The onset of restraint is at t = 0. *Significantly different from control. p < 0.05; two-way ANOVA.
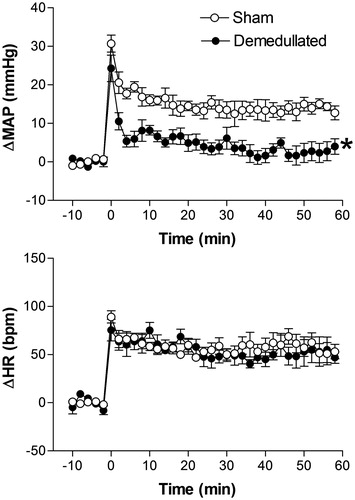
Figure 8. Mean arterial pressure (ΔMAP) and heart rate (ΔHR) changes with time during restraint in the sham-operated group (n = 6) and sinoaortic denervated group (n = 5). The onset of restraint is at t = 0. *Significantly different from control. p < 0.05; two-way ANOVA.
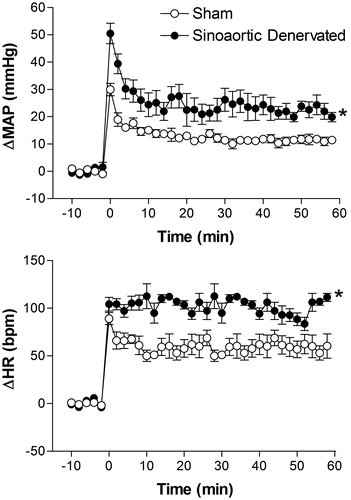
Table 1. Area under the curve (AUC) of restrain evoked hypertension (ΔMAP × Time) and tachycardia (ΔHR × Time) responses.
Table 2. Resultants of pharmacological and surgical procedures on blood pressure (hypertension) and heart (tachycardia) responses evoked by restraint (RS) in rats.