Figures & data
Table 1. Sample characteristics by sub-study.
Table 2. Associations between HCC and indices of stress, mental health, substance use/problems, disability and aggression.
Table 3. Test of quadratic associations of Perceived Stress Scale and Chronic Stress with HCC (transformed).
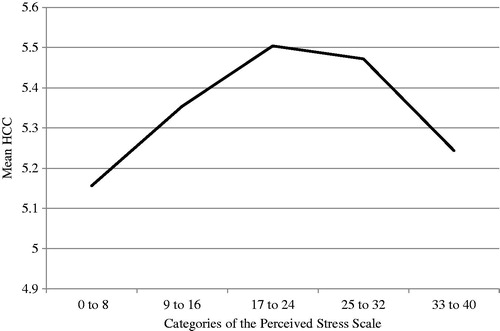
Figure 1. Mean HCC across categories of the Perceived Stress Scale. The Perceived Stress Scale was categorized as follows: 0–8, 9–16, 17–24, 25–32 and 33–40. Significant overall mean differences among the levels of stress (F(4,288) = 2.96, p < 0.01) were found, with means and standard deviations (SD) for each category of stress as follows: 0–8, mean = 5.16, SD = 0.59; 9–16, mean = 5.35, SD = 0.52; 17–24, mean = 5.50, SD = 0.60; 25–32, mean = 5.47, SD = 0.63; and 33–40, mean = 5.24, SD = 0.49.