Figures & data
Figure 1. Details of the chronic mild stress (CMS) procedure used in the present study.
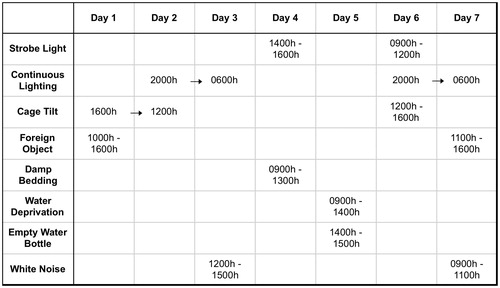
Figure 2. The impact of social isolation and chronic mild stress (CMS) on depressive behaviors in the 5-min forced swim test (FST). Mean (±standard error of the mean, SEM) duration of immobility in the FST in paired (P, n = 9), paired + CMS (P + CMS, n = 14), isolated (I, n = 11), and isolated + CMS (I + CMS, n = 11). Statistical symbols indicate value is significantly different (p < 0.05, using 2-factor, independent groups ANOVA and Fisher’s Least Significant Difference post-hoc analyses) from: * = paired group only; # = all other groups. Note: the remainder of 300 s is composed of active coping behaviors.
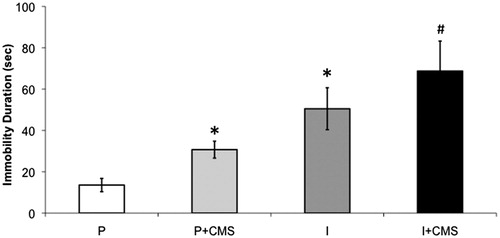
Figure 3. A representative Western blot of connexin43 (Cx43) and connexin45 (Cx45) expression in the left ventricle, relative to the loading control (glyceraldehyde 3-phosphate dehydrogenase, GAPDH), for a set of paired (P) and isolated (I) prairie voles in the presence and absence of chronic mild stress (CMS).
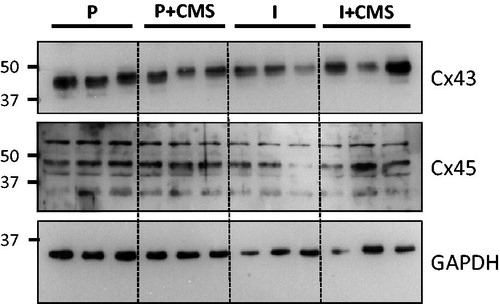
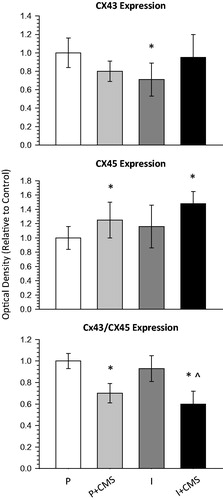
Figure 4. The impact of social isolation and chronic mild stress (CMS) on connexin43 (Cx43) and connexin45 (Cx45) expression in the left ventricle. Expression levels of Cx43 (top) and Cx45 (B) were determined by Western blot and normalized to the GAPDH loading control. In addition, the ratio of Cx43/Cx45 (bottom) was determined after normalization of Cx43 and Cx45 to GAPDH. Data are represented as the mean and standard error of the mean (SEM) for each group relative to control (paired). Quantification (mean ± SEM) of Cx43 and Cx45 expression is shown for paired (P, n = 8), paired + CMS (P + CMS, n = 9), isolated (I, n = 9), and isolated + CMS (I + CMS, n = 9). Statistical symbols indicate the value is significantly different (p < 0.05, using 2-factor, independent groups ANOVA and Student’s t-tests with a Bonferroni correction) from: * = paired group; ^ = isolated group.