Figures & data
Figure 1. Timelines for Experiments 1, 2 and 3. (A) Experiment 1. It was designed to determine the amplitude and time course of restraint-induced activation of the hypothalamic–pituitary–adrenal axis using the ABS system. ABS was started at 08:30 h on Day 10 and the shaded bars represent the three baseline (light gray), four restraint (gray) and five post-restraint (dark gray) samples. The gray arrow indicates that restraint started at 0900 h. (B) Experiment 2. It was designed to determine the pattern of plasma corticosterone (CORT) concentrations in adrenalectomized (ADX) rats drinking CORT-replacement solution (25 µg/ml CORT and 0.45% HBC in 0.9% saline), relative to diurnal rhythm of plasma CORT concentrations in adrenal-intact rats (sham-ADX), drinking tap water containing 0.45% HBC, as well as the rate of clearance of exogenous CORT in ADX rats once CORT-replacement solution was removed. ABS was initiated at 09:00 h on Day 10. Corticosterone-replacement solution was removed at 0900 h on Day 11, 24 h before the onset of restraint. The shaded bars on Day 12 represent the three baseline (light gray), four restraint (gray) and eight post-restraint (dark gray) samples, respectively. The gray arrow indicates that restraint started at 0900 h. (C) Experiment 3. It was designed to determine the effects of intra-DMH CORT infusion on restraint stress-induced HPA axis activity. Rats were habituated to insertion of injection cannulae and jugular cannulae were flushed with heparinized saline daily at 0900 h starting on Day 5 and ending on Day 10 (represented by black arrows). Corticosterone-replacement solution was removed from ADX rats 24 h prior to the beginning of sampling and replaced with 0.9% saline containing 0.45% HBC. The shaded bars on Day 11 represent the three baseline samples (light gray), two samples during intra-DMH injection and placement of rats into restraint and four samples during (gray) and seven post-restraint samples (dark gray), respectively. The gray arrow indicates that restraint started at 0900 h. ADX, adrenalectomized; CORT, corticosterone; DMH, dorsomedial hypothalamus; and HBC, hydroxypropyl-beta-cyclodextrin.
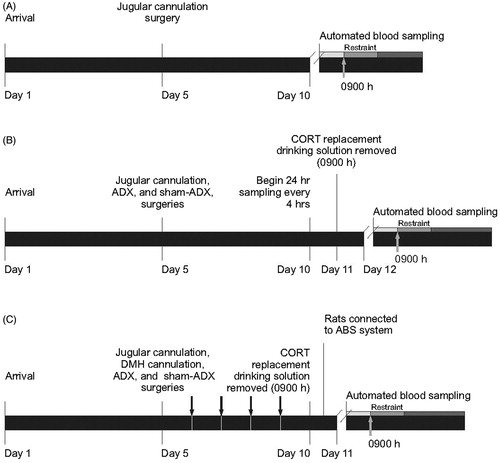
Figure 2. Bilateral injection cannulae placements for Experiment 3. The four panels were adapted from a stereotaxic atlas of the rat brain (Paxinos & Watson, Citation1998). The dorsomedial hypothalamus (DMH) was defined based on Fontes et al. (Citation2011). Open and closed circles represent cannulae placements considered inside the DMH for sham-adrenalectomized (ADX)/vehicle-treated rats and sham-ADX/corticosterone (CORT)-treated rats, respectively. 3V, 3rd ventricle; ADX, adrenalectomized; CORT, corticosterone; DA, dorsal hypothalamic area; DMC, dorsomedial hypothalamic nucleus, compact part; DMD, dorsomedial hypothalamic nucleus, dorsal part; DMV, dorsomedial hypothalamic nucleus, ventral part; f, fornix; mt, mammillothalamic tract; PH, posterior hypothalamic area; and VMH, ventromedial hypothalamic nucleus. Scale bar, 1 mm.
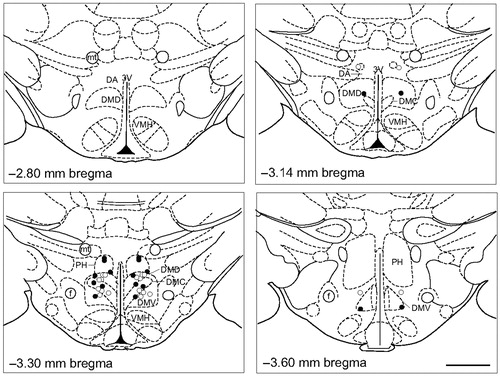
Figure 3. Baseline and restraint-induced increases in plasma corticosterone (CORT) concentrations (ng/ml) in rats in Experiment 1 (n = 7). The break between the –10 and 10 min time points is due to intentional omission of automated sampling at that time point. The gray bar between time points 0 and 40 represents the time period during which rats were restrained. Data are presented as means ± SEM (n = 7). Within group comparisons: b, p < 0.01; c, p < 0.001, generated by a linear mixed model statistical analysis.
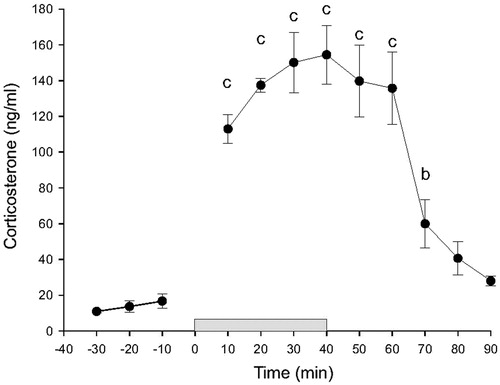
Figure 4. Plasma corticosterone (CORT) concentrations (ng/ml) in adrenalectomized (ADX) (n = 8) and sham-ADX (n = 8) rats over the course of Experiment 2. (A) The data illustrated before the break in the x-axis illustrate the diurnal rhythm of plasma CORT concentrations, measured at 4-h intervals, during a 48-h period. The white and black horizontal bars along the x-axis represent the light cycle phase (white indicates the light phase, black indicates the dark phase). The vertical gray bar represents the time at which CORT-replacement solution (25 µg/ml CORT in 0.9% saline containing 0.45% hydroxypropyl-beta-cyclodextrin (HBC)) was replaced with 0.9% saline containing 0.45% HBC for ADX rats 24 h prior to the onset of restraint. The data after the break in the x-axis illustrate baseline, restraint and post-restraint samples taken at 10-min intervals. (B) Graph illustrating plasma CORT concentrations in a representative sham-ADX rat. (C) Graph illustrating plasma CORT concentrations in a representative ADX rat. Data in A represent means ± SEM of plasma CORT concentrations for each treatment group. Between-group comparisons: *p < 0.05, **p < 0.01 and ***p < 0.001. Within-group comparisons: a = p < 0.05, c = p < 0.001. ADX, adrenalectomy; CORT, corticosterone; and HBC, hydroxypropyl-beta-cyclodextrin.
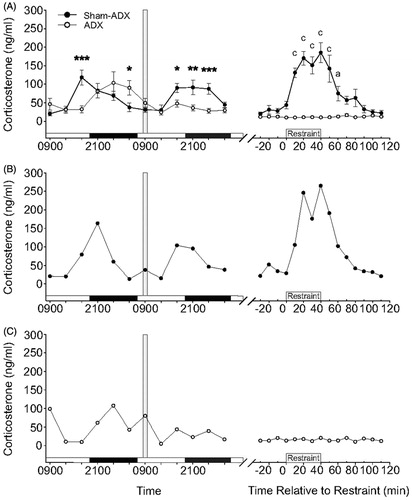
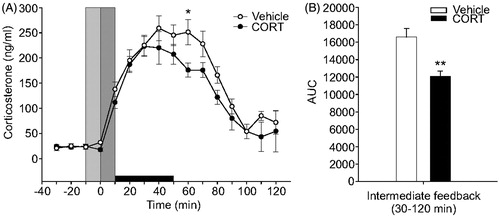
Figure 5. Effects of bilateral intra-dorsomedial hypothalamus (DMH) microinjections of corticosterone (CORT) or vehicle in sham-adrenalectomized (sham-ADX) rats exposed to a 40 min period of restraint stress on plasma CORT concentrations (ng/ml). All rats included in the data analysis had bilateral cannulae placements within the DMH. (A) Open and closed circles represent sham-ADX/vehicle-treated (n = 10) and sham-ADX/CORT-treated (n = 8) rats, respectively. Three baseline samples were taken at –10, –20 and –30 min, immediately prior to intra-DMH CORT microinjection and restraint. The vertical light gray bar indicates the window of time from –10 to 0 min during which rats were handled for insertion of injection cannulae and initiation of the intra-DMH microinjections. The vertical dark gray bar represents the time from 0 to 10 min taken to complete the intra-DMH microinjections, remove the injection cannulae and put the rats into the restraint tube. Data were normalized so that the first sample with elevated plasma CORT concentration ( > 50 ng/ml) was at the 10-min time point. The horizontal black bar indicates the 40-min restraint period, from 10 min to 50 min. (B) Graph illustrating the area under the curve for the intermediate (30–120 min) feedback timeframe. CORT-treated rats showed a significantly attenuated HPA axis response during the intermediate feedback timeframe (p < 0.01). ADX, adrenalectomy; AUC, area under the curve; and CORT, corticosterone. Between-group comparisons: *p < 0.05, **p < 0.01, Fisher's protected least significant difference (LSD) test.