Figures & data
Figure 1. A timeline diagram of experiments in the present study. E1: Embryonic day 1; E3: Embryonic day 3; E5: Embryonic day 5; E7: Embryonic day 7. At the beginning, there were 154 pregnant mice: for histological and immunocytochemical evaluation of the uterus, 3 groups of 10 mice were exposed each day to restraint stress, and one group of 10 was killed on day E3, E5 and E7; similarly, a group of 10 control mice, not exposed to the stressor was killed on each of these days (60 mice in total); the remaining 52 mice were not exposed to stress and were killed on E5 to collect uteri for in vitro studies, in groups of 8–9 across 6 H2O2 doses.
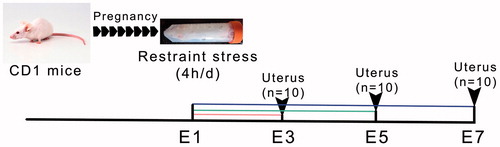
Table 1. Effect of restraint stress on food intake and body weight of pregnant mice during embryo implantation.
Figure 2. Effects of restraint stress on the actual and relative weight (percent body weight) of uterus and ovary during mouse embryo implantation. Data are expressed as mean ± SEM (n = 10 mice per group). Different uppercase letters represent significant differences among E3, E5 and E7 in the control group (p < 0.05), and different lowercase letters represent significant differences among E3, E5 and E7 in the stressed group (p < 0.05) (two-way ANOVA followed by Duncan post hoc test). *p < 0.05 and #p < 0.01 denote significance compared to the corresponding control group (independent samples t-test). The relative weight of uterus and ovary was calculated as organ-to-body weight ratio (×100%). E3: Embryonic day 3; E5: Embryonic day 5; E7: Embryonic day 7.

Figure 3. The dynamic structure of the uterus during mouse embryo implantation. Under an optical microscope with 40× objective, the uterine transverse section is oval-shaped and consists of three outside-in histological elements: the perimetrium, the myometrium and the endometrium. The myometrium contains an inner circular layer and an outer longitudinal layer of smooth muscle. In addition, a vascular layer is located between the muscle layers. On E7, the embryo and the decidual area are shown in the uterine section. DB: Decidua basalis; E: Embryo; End: Endometrium; E3: Embryonic day 3; E5: Embryonic day 5; E7: Embryonic day 7; M: Mesometrium; UL: Uterine lumen. Bar = 500 μm.
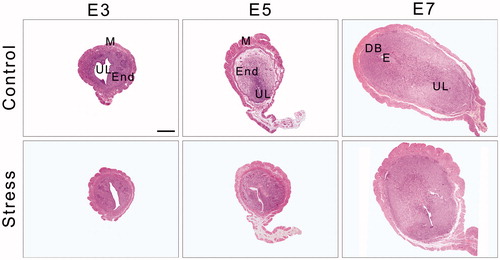
Figure 4. Effects of restraint stress on the morphology of the endometrium and uterine glands during mouse embryo implantation. Data are mean ± SEM (n = 10 mice per group). Different uppercase letters represent significant differences among E3, E5 and E7 in the control group (p < 0.05), and different lowercase letters represent significant differences among E3, E5 and E7 in the stressed group (p < 0.05) (two-way ANOVA followed by Duncan post hoc test). *p < 0.05 and #p < 0.01 denote significance compared to the corresponding control group (independent samples t-test). Long arrows indicate obliteration of uterine glands and arrowheads indicate vacuolation of a glandular epithelial cell. E3: Embryonic day 3; E5: Embryonic day 5; E7: Embryonic day 7. Bar = 20 μm.
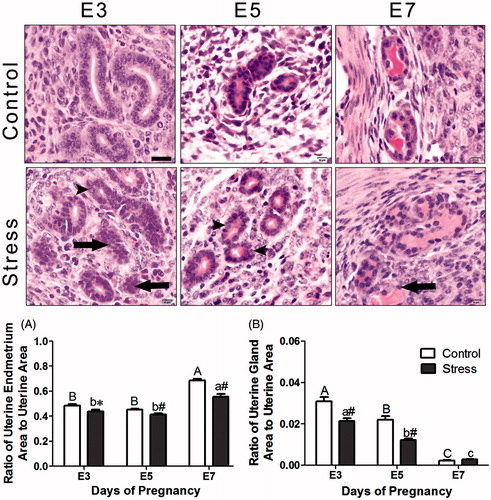
Figure 5. Immunohistochemical staining for CD34 and VEGF was used to identify angiogenesis and new microvessel formation. Long arrows indicate a CD34-positive cell and arrowheads indicate a VEGF-positive cell. E3: Embryonic day 3; E5: Embryonic day 5; E7: Embryonic day 7; VEGF: Vascular endothelial growth factor. Bar = 50 μm.
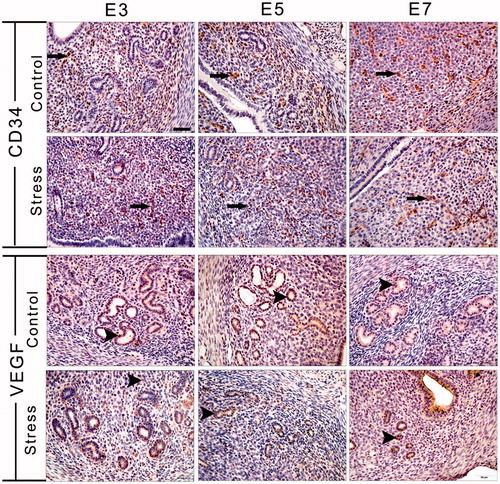
Figure 6. Effects of restraint stress on the vascular biomarkers VEGF and CD34 during mouse embryo implantation. Data are mean ± SEM (n = 10 mice per group). Different uppercase letters represent significant differences among E3, E5 and E7 in the control group (p < 0.05), and different lowercase letters represent significant differences among E3, E5 and E7 in the stressed group (p < 0.05) (two-way ANOVA followed by Duncan post hoc test). *p < 0.05 and #p < 0.01 denote significance compared to the corresponding control group (independent samples t-test). E3: Embryonic day 3; E5: Embryonic day 5; E7: Embryonic day 7. VEGF: Vascular endothelial growth factor.
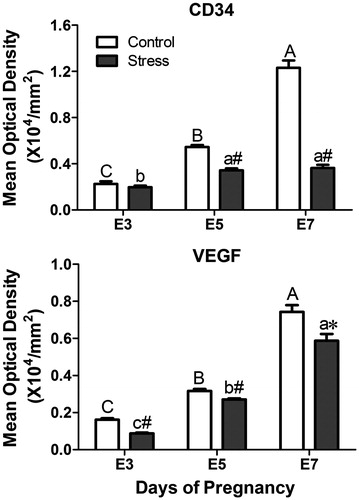
Figure 7. Immunohistochemical staining with PCNA was used to visualize uterine cell proliferation, and the TUNEL method detected apoptosis of endometrial cells. Long arrows indicate a PCNA-positive cell and arrowheads indicate a TUNEL-positive cell. E3: Embryonic day 3; E5: Embryonic day 5; E7: Embryonic day 7; PCNA: Proliferating cell nuclear antigen; TUNEL: Terminal deoxynucleotidyl transferase dUTP nick end labeling. Bar = 50 μm.
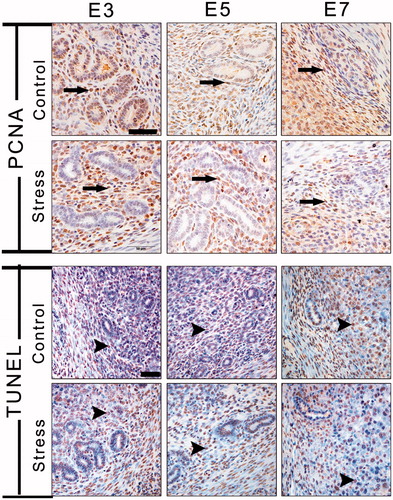
Figure 8. Effects of restraint stress on proliferation and apoptosis in the uterus during mouse embryo implantation. Data are mean ± SEM (n = 10 mice per group). Different uppercase letters represent significant differences among E3, E5 and E7 in the control group (p < 0.05), and different lowercase letters represent significant differences among E3, E5 and E7 in the stressed group (p < 0.05) (two-way ANOVA followed by Duncan post hoc test). *p < 0.05 and #p < 0.01 denote significance compared to the corresponding control group (independent samples t-test). E3: Embryonic day 3; E5: Embryonic day 5; E7: Embryonic day 7. MOD: Mean optical density.
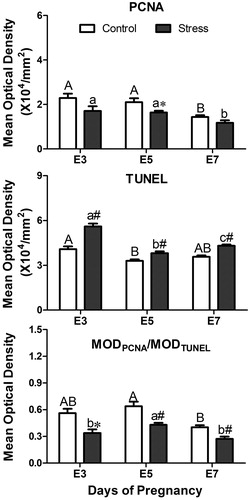
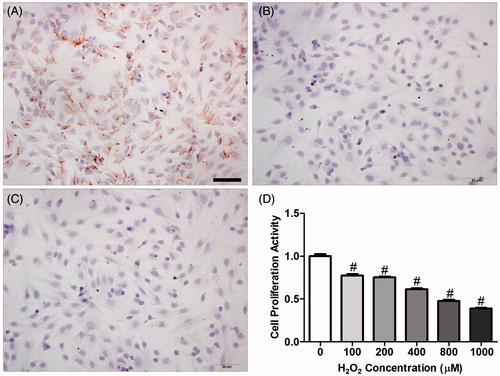
Figure 9. Immunohistochemical staining with vimentin and cytokeratin was used to identify endometrial stromal cell (ESC) purity. (A) vimentin (+); (B) cytokeratin (−); (C) negative control; (D) effect of oxidant (H2O2) on ESC proliferation in vitro. To confirm that H2O2 induces apoptosis in endometrium cells, ESCs were treated with H2O2 over a 24-h time course and the proliferative activity of ESCs was measured by methyl thiazolyl tetrazolium (MTT) assay. Data are expressed as mean ± SEM (n = 9, number of pregnant control mice used to provide ESCs per H2O2 concentration) and analyzed by one-way ANOVA with a LSD post hoc test. #p < 0.01 denotes significance compared to the control group (zero H2O2). E3: Embryonic day 3; E5: Embryonic day 5; E7: Embryonic day 7. Bar = 50 μm.