Figures & data
Table 1. Experimental design for phase I and II regarding phenotypic appearance (PA) assignment within groups (flocks) for each group size (10 or 40 birds per pen, flock).
Figure 1. Plasma corticosterone concentrations in adult hens with different artificial phenotypic appearance (PA) from day one of age. Basal = birds reared in regular husbandry conditions; Stressed = same birds submitted to 5 min acute stress consisting of individual isolation in a novel environment. Bars represent the mean ± SE (number of birds per homogeneous or heterogeneous group/phenotype condition = 9, total number of birds in the study = 180). Data were analyzed by mixed-model ANOVA; p = 0.001, stressed > basal; no significant effects of PA or GS. M = marked; UM = unmarked; 100, 30, 50 and 70 = 100, 30, 50 and 70% of the birds within a flock either marked or unmarked. Group size 10 = birds reared in groups of 10 individuals. Group size 40 = birds reared in groups of 40 individuals.
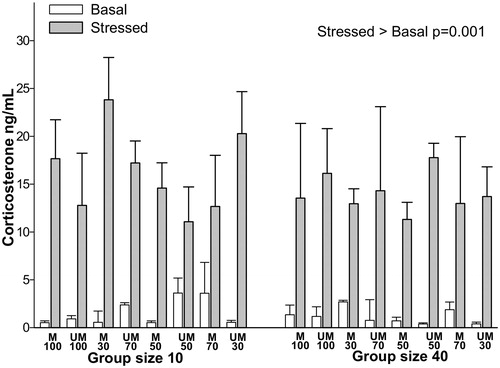
Table 2. Immune-related variables measured (mean ± SE) in adult laying hens with different artificial phenotypic appearance (PA) from day one of age.
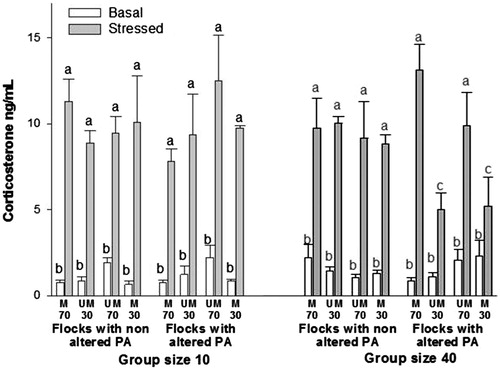
Figure 2. Plasma corticosterone concentrations after changing the phenotypic appearance (PA) of 70% of a flock during adulthood. Basal = birds reared in regular husbandry conditions; Stressed = same birds submitted to 5 min acute stress consisting of individual isolation in a novel environment. Bars represent the mean ± SE (number of birds per treatment = 9, total number of birds in the study = 144). Data were analyzed by mixed-model ANOVA. M = marked; UM = unmarked; 30 and 70 = 30% and 70% of the birds within the flock (i.e., group/pen) either marked or unmarked. Flocks with nonaltered PA: PA of all birds within the flock remained unchanged from day 1 of age. Flocks with altered PA = PA of birds was either changed during adulthood or remained unchanged from day 1 of age. Group size 10 = birds reared in groups of 10; Group size 40 = birds reared in groups of 40. a,cStressed groups with no common letters differ significantly (p < 0.05; Fisher least significant difference test).