Figures & data
Figure 1. A representative image of the gating procedure. We first used a forward (FSC-H) and side scatter (SSC-A) histogram (a) to gate on the lymphocyte population. Then we used IgG1 FITC-A by IgG1 PE histogram (b) as the negative control. Histogram (c) shows the percentage of CD19 + and CD3 + cells in the lymphocyte gate. The CD19 + subset is shown in histograms (d) and (e).
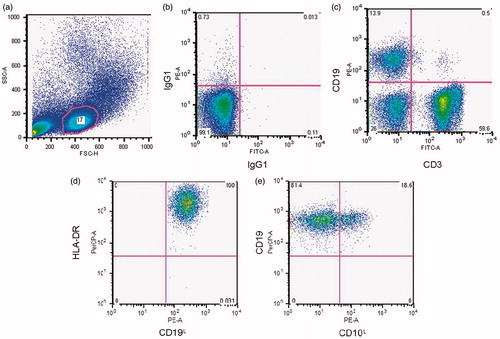
Table 1. Demographic characteristics of sample.
Table 2. Descriptive statistics for all measures among students and community controls at each time point.
Figure 2. Change in CD19 + B Lymphocytes over time among students and community comparison participants. Student status predicted a significant decrease in CD19 + lymphocyte percentage when controlling for T1 CD19 + percentage and T2 PBMC (β = 0.275, *R2 = 0.061, p = 0.025). *p < 0.05.
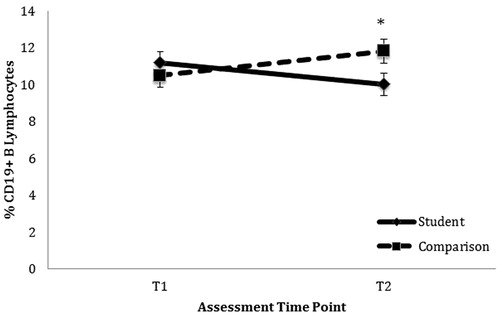
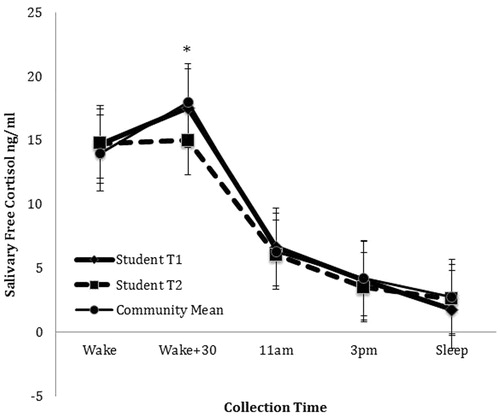
Figure 3. Flattening of CAR from T1 to T2 among students compared to community comparison group (mean of T1 and T2). Note: *indicates that Student T2 salivary cortisol is significantly lower than student salivary cortisol levels at T1 or the community mean.