Publication Cover
Stress
The International Journal on the Biology of Stress
Volume 13, 2010 - Issue 3
345
Views
15
CrossRef citations to date
0
Altmetric
Research Article

Salivary glands as the source of plasma brain-derived neurotrophic factor in stressed rats engaged in biting behavior

, , , , &
Pages 238-247 | Received 02 Apr 2009, Accepted 30 Aug 2009, Published online: 15 Apr 2010

Figures & data

Table I.  Plasma concentrations of ACTH: control, stress, or stress+biting (intact, sham, or SA).

Table II.  Plasma concentrations of corticosterone: control, stress, or stress+biting (intact, sham, or SA).

Figure 1. BDNF mRNA quantification in rat submandibular glands in stress and stress+biting-intact groups. Data are BDNF/β-actin mRNA ratios. Control: no stress group; stress: 2 h acute immobilization stress group; stress+biting: 2 h acute immobilization stress group allowed to bite a wooden stick (diameter, 0.5 cm) during the latter half of the immobilization period (60 min); intact: no surgery. Values are means ± SEM; n = 8 rats in each group. *p < 0.05, **p < 0.01, ANOVA/Tukey's.
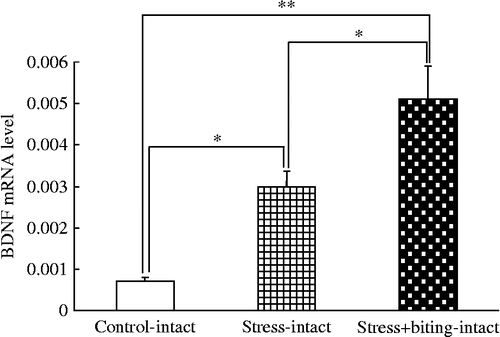
Figure 1.  BDNF mRNA quantification in rat submandibular glands in stress and stress+biting-intact groups. Data are BDNF/β-actin mRNA ratios. Control: no stress group; stress: 2 h acute immobilization stress group; stress+biting: 2 h acute immobilization stress group allowed to bite a wooden stick (diameter, 0.5 cm) during the latter half of the immobilization period (60 min); intact: no surgery. Values are means ± SEM; n = 8 rats in each group. *p < 0.05, **p < 0.01, ANOVA/Tukey's.
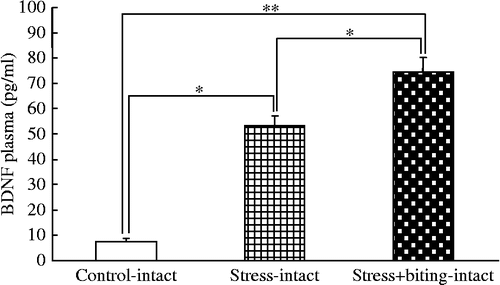
Figure 2. BDNF plasma concentrations in stress and stress+biting-intact groups. Data are plasma BDNF concentrations in terminal cardiac puncture blood samples. Control: no stress group; stress: 2 h acute immobilization stress group; stress+biting: 2 h acute immobilization stress group allowed to bite a wooden stick (diameter, 0.5 cm) during the latter half of the immobilization period (60 min); Intact: no surgery. Values are means ± SEM; n = 8 rats in each group. *p < 0.05, **p < 0.01, ANOVA/Tukey's.

Figure 2.  BDNF plasma concentrations in stress and stress+biting-intact groups. Data are plasma BDNF concentrations in terminal cardiac puncture blood samples. Control: no stress group; stress: 2 h acute immobilization stress group; stress+biting: 2 h acute immobilization stress group allowed to bite a wooden stick (diameter, 0.5 cm) during the latter half of the immobilization period (60 min); Intact: no surgery. Values are means ± SEM; n = 8 rats in each group. *p < 0.05, **p < 0.01, ANOVA/Tukey's.

Figure 3. BDNF immunohistochemistry in submandibular glands of control, stress, and stress+biting-intact groups. Photomicrographs show the immunohistochemical localization of BDNF protein, identified with an anti-BDNF monoclonal antibody in paraffin-embedded sections of submandibular gland from: (A) control, non-stressed rat: only faint staining was observed; (B) stressed rat after 2 h acute immobilization stress: BDNF protein was observed in duct cells, but there was no obvious BDNF expression in acinar cells (arrows); and (C) stress+biting rat, after 2 h acute immobilization stress allowed to bite a wooden stick (diameter, 0.5 cm) during the latter half of the immobilization period (60 min); BDNF protein was observed in duct cells but there was no obvious BDNF expression in acinar cells (arrows). Intact: no surgery. Scale bar = 50 μm (A–C).
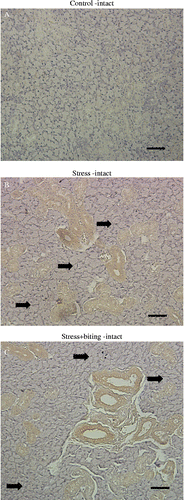
Figure 3.  BDNF immunohistochemistry in submandibular glands of control, stress, and stress+biting-intact groups. Photomicrographs show the immunohistochemical localization of BDNF protein, identified with an anti-BDNF monoclonal antibody in paraffin-embedded sections of submandibular gland from: (A) control, non-stressed rat: only faint staining was observed; (B) stressed rat after 2 h acute immobilization stress: BDNF protein was observed in duct cells, but there was no obvious BDNF expression in acinar cells (arrows); and (C) stress+biting rat, after 2 h acute immobilization stress allowed to bite a wooden stick (diameter, 0.5 cm) during the latter half of the immobilization period (60 min); BDNF protein was observed in duct cells but there was no obvious BDNF expression in acinar cells (arrows). Intact: no surgery. Scale bar = 50 μm (A–C).

Figure 4. Effects of stress and stress-biting on salivary gland BDNF expression. Upper panel: Western blot analysis of BDNF expression with equal amounts of protein from submandibular glands of control, stress, stress+biting, control-sham, stress-sham, and stress+biting-sham rats. Control: no stress group; stress: 2 h acute immobilization stress group; stress+biting: 2 h acute immobilization stress group allowed to bite a wooden stick (diameter, 0.5 cm) during the latter half of the immobilization period (60 min); intact: no surgery; sham: sham SA. Blots for BDNF show that level of this protein is increased in the submandibular glands of rats subjected to stress and is more strongly increased in the submandibular glands of rats subjected to stress+biting. BDNF protein level is also increased in the submandibular glands of stress-sham rats and more strongly increased in the submandibular glands of stress+biting-sham rats. GAPDH expression is similar in control, stress, stress+biting, control-sham, stress-sham, and stress+biting-sham rats. Lower panel: Semi-quantitative analysis of western blots by densitometry. The intensities of BDNF bands were normalized with respect to the intensities of GAPDH bands detected on the same blots. Values are means ± SEM; n = 8 rats in each group. *p < 0.05, **p < 0.001, ANOVA/Tukey's.
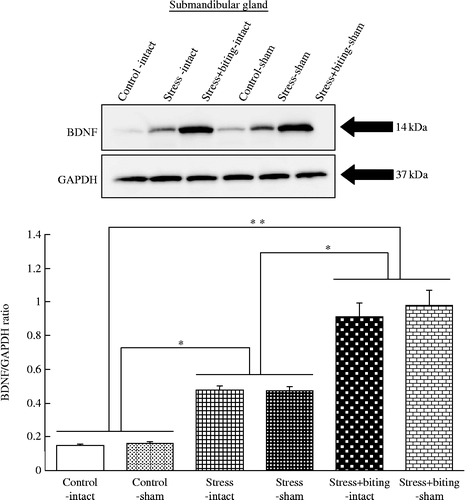
Figure 4.  Effects of stress and stress-biting on salivary gland BDNF expression. Upper panel: Western blot analysis of BDNF expression with equal amounts of protein from submandibular glands of control, stress, stress+biting, control-sham, stress-sham, and stress+biting-sham rats. Control: no stress group; stress: 2 h acute immobilization stress group; stress+biting: 2 h acute immobilization stress group allowed to bite a wooden stick (diameter, 0.5 cm) during the latter half of the immobilization period (60 min); intact: no surgery; sham: sham SA. Blots for BDNF show that level of this protein is increased in the submandibular glands of rats subjected to stress and is more strongly increased in the submandibular glands of rats subjected to stress+biting. BDNF protein level is also increased in the submandibular glands of stress-sham rats and more strongly increased in the submandibular glands of stress+biting-sham rats. GAPDH expression is similar in control, stress, stress+biting, control-sham, stress-sham, and stress+biting-sham rats. Lower panel: Semi-quantitative analysis of western blots by densitometry. The intensities of BDNF bands were normalized with respect to the intensities of GAPDH bands detected on the same blots. Values are means ± SEM; n = 8 rats in each group. *p < 0.05, **p < 0.001, ANOVA/Tukey's.

Figure 5. Plasma BDNF concentrations in stress or stress+biting and SA groups. Data are terminal plasma BDNF concentrations in cardiac puncture blood samples. Control: no stress group; stress: 2 h acute immobilization stress group; stress+biting: 2 h acute immobilization stress group allowed to bite a wooden stick (diameter, 0.5 cm) during the latter half of the immobilization period (60 min); intact: no surgery; SA: removal of submandibular glands before acute immobilization stress or stress and biting; sham: sham SA before stress or stress and biting. Values are means ± SEM; n = 8 rats in each group. *p < 0.05, **p < 0.001, ANOVA/Tukey's.
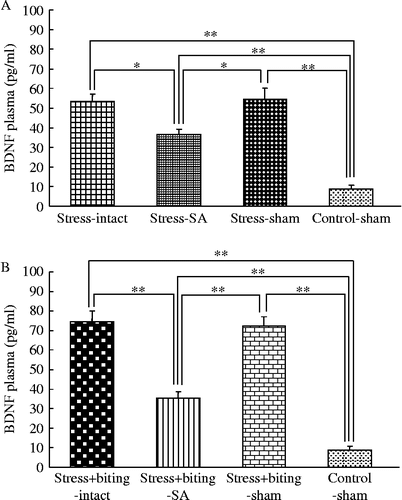
Figure 5.  Plasma BDNF concentrations in stress or stress+biting and SA groups. Data are terminal plasma BDNF concentrations in cardiac puncture blood samples. Control: no stress group; stress: 2 h acute immobilization stress group; stress+biting: 2 h acute immobilization stress group allowed to bite a wooden stick (diameter, 0.5 cm) during the latter half of the immobilization period (60 min); intact: no surgery; SA: removal of submandibular glands before acute immobilization stress or stress and biting; sham: sham SA before stress or stress and biting. Values are means ± SEM; n = 8 rats in each group. *p < 0.05, **p < 0.001, ANOVA/Tukey's.

Reprints and Corporate Permissions

Please note: Selecting permissions does not provide access to the full text of the article, please see our help page How do I view content?

To request a reprint or corporate permissions for this article, please click on the relevant link below:

Academic Permissions

Please note: Selecting permissions does not provide access to the full text of the article, please see our help page How do I view content?

Obtain permissions instantly via Rightslink by clicking on the button below:

If you are unable to obtain permissions via Rightslink, please complete and submit this Permissions form. For more information, please visit our Permissions help page.