Figures & data
Figure 1. Biological processes affected by diverse environmental perturbations. Arrows pointing up- and downwards are used to indicate gene induction and repression respectively. CESR, core environmental stress response.
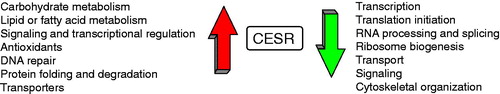
Figure 2. Upstream stress-sensing mechanisms and the mitogen-activated protein kinase (MAPK) family of proteins form a complex molecular network in response to environmental stimuli. (A) The basic architecture of MAPK pathways. TF, transcription factor; MAPKKK, mitogen-activated protein kinase kinase kinase; MAPKK, mitogen-activated protein kinase kinase; MAPK, mitogen-activated protein kinase. (B) A comparative view of stress sensing and signaling mechanisms in fungi and mammals reveals highly conserved modules.
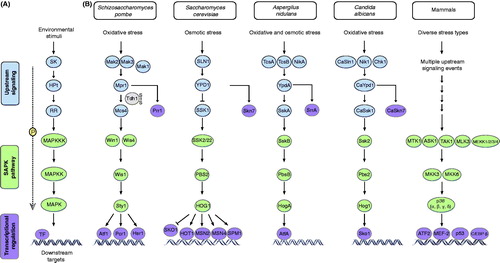
Figure 3. Molecular and functional overlap of the fission yeast stress-activated protein kinase (SAPK) and the cell integrity pathways. Colors used to represent different type of molecules are explained in the lower left part of the figure.
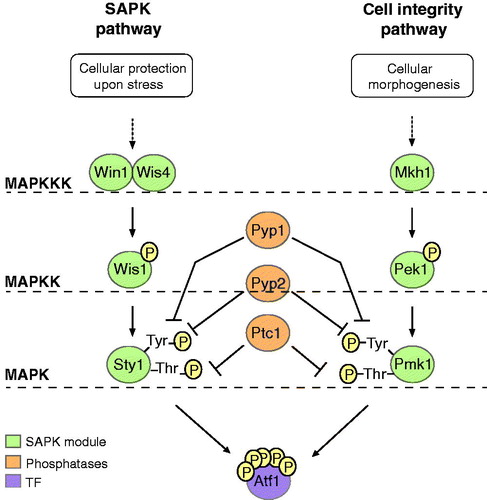
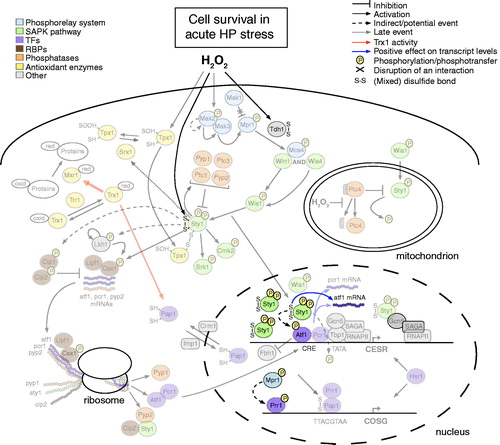
Figure 4. Overview of molecular events that promote cell survival upon intermediate oxidative stress (0.25–1.0 mM HP). The thickness of the arrows associated with the activity of thioredoxin (Trx1) provides a quantitative indication of the relative reaction rates. CESR, core environmental stress response genes; COSG, core oxidative stress genes; CRE, cAMP-responsive element; TATA, TATA/Goldberg-Hogness box (5′-TATAA-3′); RNAPII, RNA polymerase II; SAGA, Spt-Ada-Gcn5-Acetyltransferase; oxid, oxidized; red, reduced. Additional graphical representations are explained in the upper left and right parts of the figure.
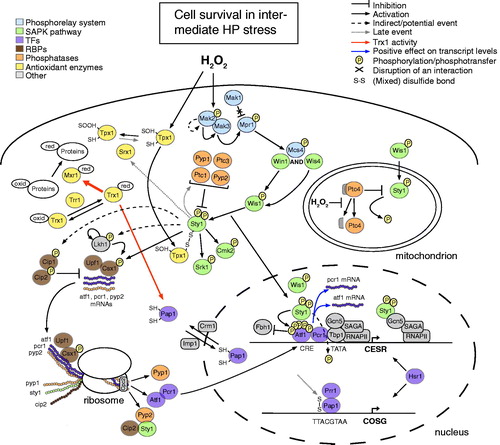
Figure 6. Overview of molecular events that enable cellular adaptation to mild oxidative stress (<0.25 mM HP). Faded parts of the figure correspond to events, whose occurrence remains elusive in low HP doses (e.g. the Ptc4-mediated regulation of Sty1 and the Sty1-mediated phosphorylation of the Srk1 and Cmk2 MAPKAPKs). The thickness of the arrows associated with the activity of thioredoxin (Trx1) provides a quantitative indication of the relative reaction rates. In the presence of low HP levels, the import of the Pap1 TF into the nucleus predominates the export to the cytoplasm, a fact indicated by a thicker arrow for Pap1 import. CESR, core environmental stress response genes; COSG, core oxidative stress genes; CRE, cAMP-responsive element; RNAPII, RNA polymerase II; SAGA, Spt-Ada-Gcn5-Acetyltransferase; oxid, oxidized; red, reduced. Additional graphical representations are explained in the upper left and right parts of the figure.
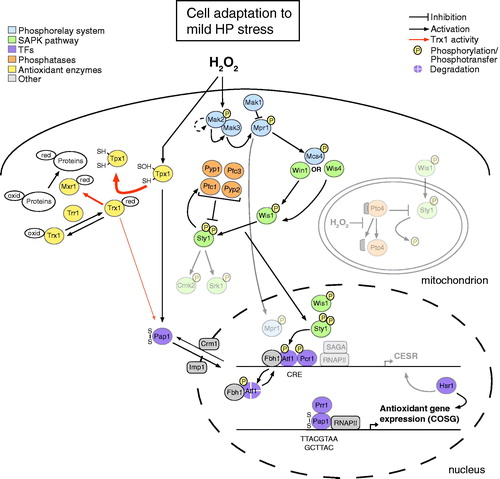
Figure 5. Molecular mechanisms that are specifically employed upon exposure to acute oxidative stress conditions (>1.0 mM HP). To emphasize molecular events that occur specifically in extreme – but not intermediate – HP stress, many branches of the demonstrated molecular network appear faded. Most of these branches remain, however, active even in very high HP doses (e.g. the SAPK pathway and the multistep phosphorelay sytem) (Quinn et al., 2002, Citation2011). Whether other faded parts of the figure represent active events in very high HP doses awaits validation (e.g. the (de)stabilization effects of the Csx1, Upf1, Cip1 and Cip2 RNA-binding proteins). The different graphical representations of the figure are explained in the upper left and right parts.