Figures & data
Table 1. Selected noncancer studies for DEHP−reproductive/developmental effects considered for case study.
Table 2. Selected cancer studies for DEHP considered for case study.
Table 3. Effects on androgenic status, developmental landmarks and testicular histology in male offspring rats reported by Andrade et al. (Citation2006a).
Table 4. Effects on female rat reproductive development following administration of DEHP reported by Grande et al. (Citation2006).
Table 5. Reproductive effects reported by Andrade et al. (Citation2006b) adult male rat offspring following administration of DEHP.
Table 6. Reproductive effects reported adult female offspring rats following administration of DEHP (Grande et al.,2007).
Table 7. Effects on rat brain aromatase activity following gavage administration of DEHP (Andrade et al.,2006c).
Table 8. Changes in serum testosterone and LH levels following gavage administration of DEHP (Akingbemi et al.,2001).
Table 9. Change in reproductive parameters reported in male rats following gavage administration of DEHP (Akingbemi et al.,2001).
Table 10. Changes in Reproductive Parameters reported by Akingbemi et al. (Citation2004) in male rats following gavage exposure to DEHP.
Table 11. Biphasic effects of reported in male rats following postnatal exposure to DEHP for 28 days (PND 21 to 48)+ (Ge et al.,2007a).
Table 12. Summary of results from the multigenerational reproductive assessment by continuous breeding conducted by NTP (Citation2004) in Sprague-Dawley rats in which DEHP was administered in the diet (NTP Citation2004).
Table 13. Summary of sexual development data from NTP (Citation2004).
Table 14. The effects of subacute inhalation of DEHP on selected endpoints in prepubertal Wistar rats (Kurahashi et al., 2005).
Table 15. Reproductive effects reported in prepubertal female rats following inhalation exposure to DEHP (Ma et al.,2006).
Table 16. Incidence of tumors reported in male Sprague-Dawley rats following lifetime dietary administration of DEHP (Voss et al.,2005).
Table 17. Incidences of hepatocellular neoplasms in fischer 334 rats following lifetime administration of DEHP (David et al.,1999).
Table 18. Incidences of histopathological lesions reported in male fischer 334 rats administered DEHP in the diet (David et al.,2000a).
Table 19. Incidence of tumors reported in male and female rats following administration of DEHP (NTP Citation1982).
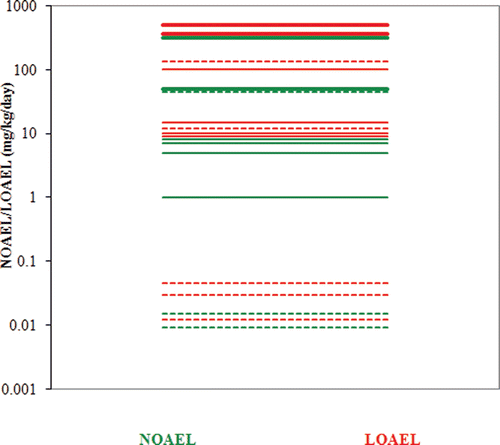
Table 20. NOAELs/LOAELs for reproductive/development endpoints based on evaluation of statistical results.
Figure 1. Anogenital distance of male offspring rats (PND 22) exposed in utero and during lactation to peanut oil (vehicle control) or DEHP (Andrade et al. Citation2006a). Bars indicate mean±S.E.
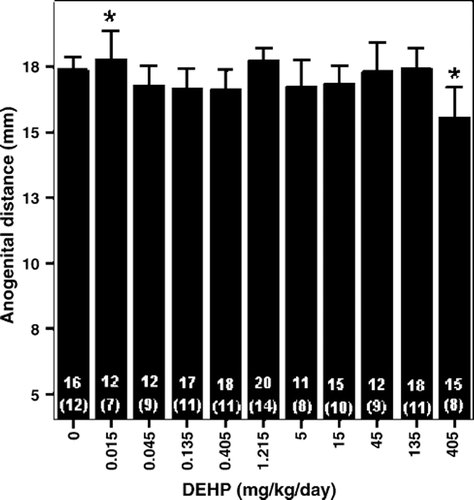
Figure 2. Effects of in utero and lactational DEHP exposure on daily sperm production in adult male offspring rats (Andrade et al. Citation2006). This figure shows the absolute and relative proportion of animals with sperm production above and below 34 million sperm/testis. Number of animals is indicated inside bars. *Significantly different from concurrent control. §Significantly different from historical control.
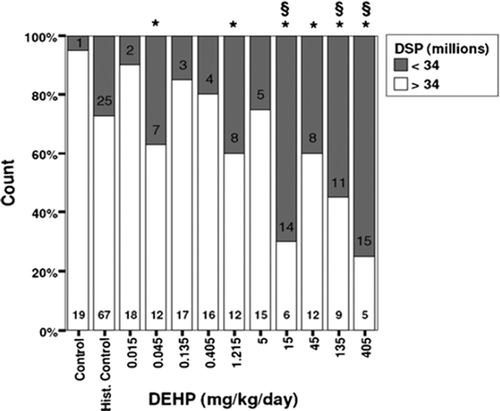
Figure 3. Biphasic effect of di(2-ethylhexyl)phthalate (DEHP) exposures on puberty (Ge et al. Citation2007a). Pubertal onset was assessed by preputial separation. Prepubertal rats were gavaged with DEHP (0, 10, 500, and 750 mg/kg/d). The time course of the accumulative frequency of rats with preputial separation was fitted by sigmoidal nonlinear regression. Average age was calculated as the intercept at 50% accumulative frequency, shown as the dotted line.
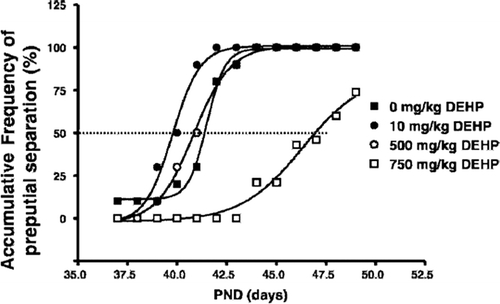
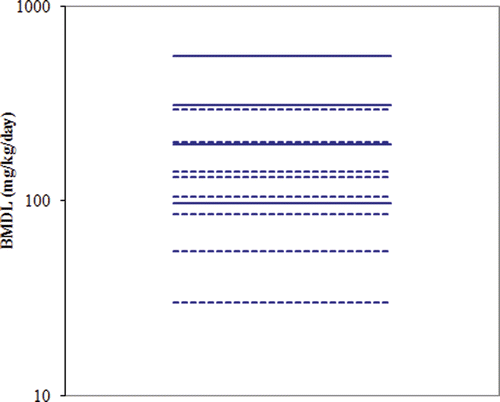
Table 21. BMD Modeling results based on selected reproductive endpoints using external administered doses as the relevant dose metric. (Data relied upon provided in and ).
Table 22. BMD Modeling results using external maternal doses (mg/kg/day) as the relevant dose metric. (Data relied upon provided in and ).
Table 23. BMD Modeling Results considering age at vaginal opening in Wistar rats () as a continuous endpoint as reported by Grande et al., (Citation2006) Study and using external maternal doses (mg/kg/day) as the relevant dose metric.
Table 24. BMD Modeling Results considering age at vaginal opening in Wistar rats () as a dichotomous endpoint as reported by Grande et al., (Citation2006) Study and using external maternal doses (mg/kg/day) as the relevant dose metric.
Table 25. BMD modeling results for considering day of preputial opening in male Wistar rats () as a dichotomous endpoint as reported by Andrade et al. (Citation2006c) and using external maternal dose (mg/kg/day) as the relevant dose metric.
Table 26. BMD Modeling results for changes in sperm production in Wistar rats () from Andrade et al. (Citation2006a) using external maternal dose (mg/kg/day) as the relevant dose metric.
Table 27. BMD modeling results from Ma et al. (Citation2006) () and Kurahashi et al. (Citation2005) () using external inhalation concentration (mg/m3) as the relevant dose metric.
Figure 4a. BMD modeling of the age of vaginal opening in female Wistar rats following inhalation exposure to DEHP as reported by Ma et al. (Citation2006) (Experiment 1− exposure PND 22–84).
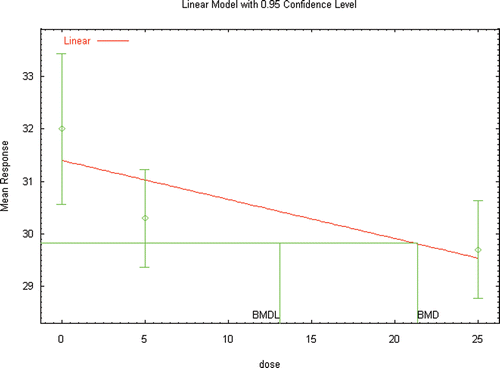
Figure 4b. BMD modeling of the age of vaginal opening in female Wistar rats following inhalation exposure to DEHP as reported by Ma et al. (Citation2006) (Experiment 2− exposure PND 22–41).
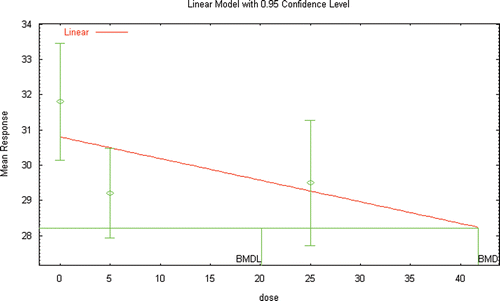
Figure 5a. BMD modeling of the changes in plasma testosterone reported in male Wister rats following inhalation exposure to DEHP (Kurahashi et al. Citation2005).
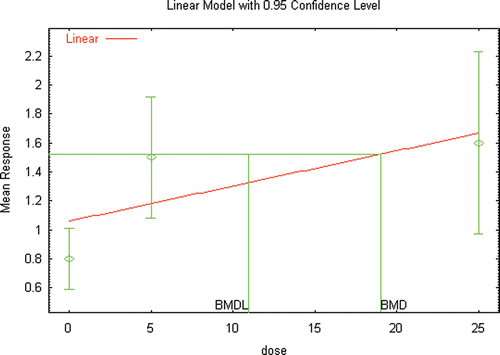
Figure 5b. BMD modeling of the changes in seminal vesicle weight reported in male Wister rats following inhalation exposure to DEHP (Kurahashi et al. Citation2005).
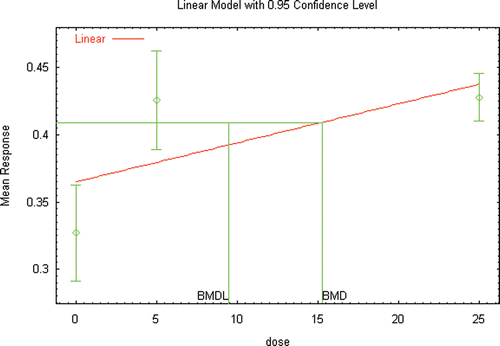
Figure 6a. BMD modeling (unconstrained) of the changes in plasma testosterone reported in male Wister rats following inhalation exposure to DEHP (Kurahashi et al. Citation2005).
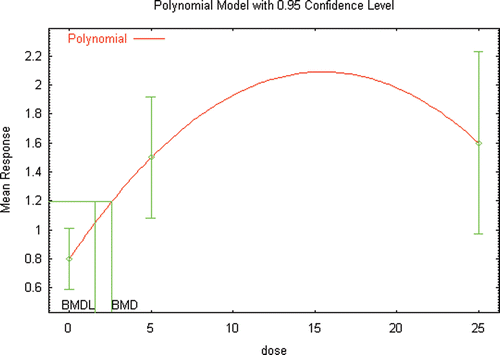
Figure 6b. BMD modeling (unconstrained) of the changes in seminal vesicle weight reported in male Wister rats following inhalation exposure to DEHP (Kurahashi et al. Citation2005).
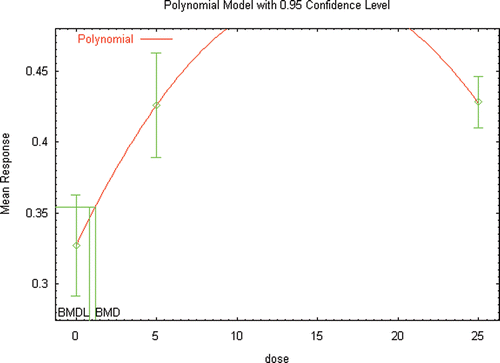
Table 28. Illustrative Categorization of Evidence Based on Animal and Human Data1
Table 29. BMD modeling results for liver tumors in mice and rats reported by NTP (1982) () using external dose (mg/kg/day) as the relevant dose metric.
Table 30. BMD modeling results for liver tumors as reported by David et al., (1999) () using external dose (mg/kg/day) as the relevant dose metric.
Table 31. BMD modeling results for pancreatic acinar cell and hepatic lesions reported by David et al. (2000a) () using external doses (mg/kg/day) as the relevant dose metric.
Table 32. BMD Modeling results for pancreatic, liver, and Leydig cell lesions reported by Voss et al., (2005) () using external doses (mg/kg/day) as the relevant dose metric.
Figure 7. Model structure for DEHP/DBP kinetics in the pregnant rat. Adult male rat model is identical with the exception of the placenta/fetus compartments. Lactation model has two added compartments the diester and free monoester in the mammary gland and milk. Dashed arrows indicate first order processes. Bold dashed arrows represent saturable processes. Solid arrows represent blood flows to the tissue compartments and are diffusion limited.
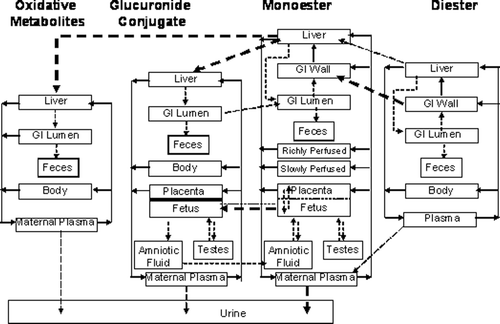
Figure 8. Excretion of DEHP metabolites in urine after a single oral dose in one randomly chosen platelet donor reported by Koch et al. (Citation2005). The estimated dose was approximately 0.048 mg/kg over a 45 min infusion.
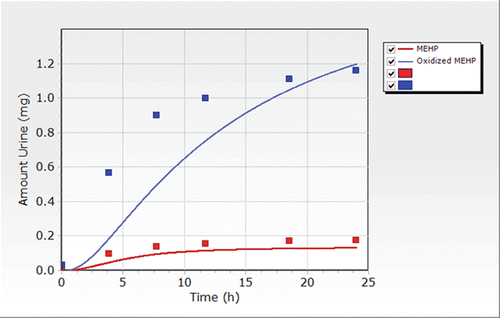
Figure 9. Total amount of MEHP excreted in urine after a single oral dose of 38 mg on buttered toast to a single volunteer (Koch, Citation2004).
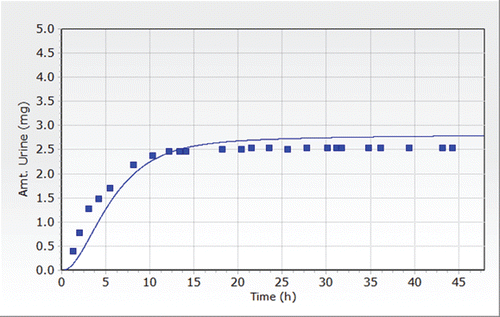
Table 33. Model parameters and distributions used for the DEHP human PBPK model Monte Carlo Analysis.
Table 34. Additional model parameters and distributions used for the DEHP human pregnancy PBPK model Monte Carlo Analysis.
Table 35. Additional model parameters and distributions used for the DEHP human lactation PBPK model Monte Carlo Analysis.
Table 36. Pregnancy and lactation dose metrics for the rat estimated applying the PBPK model.
Table 37. Postnatal dose metrics in the rat estimated applying the PBPK model.
Table 38. Dose metrics estimated for the multigenerational study conducted by rats by NTP (Citation2004).
Table 39. Dose metrics for lifetime dietary administration of DEHP in rats estimated using the PBPK model.
Table 40. BMD modeling results for selected noncancer endpoints incorporated dose metrics estimated using the PBPK model.
Table 41. BMD modeling results for cancer endpoints from Voss et al., (2005) incorporating dose metrics estimated using a PBPK model.
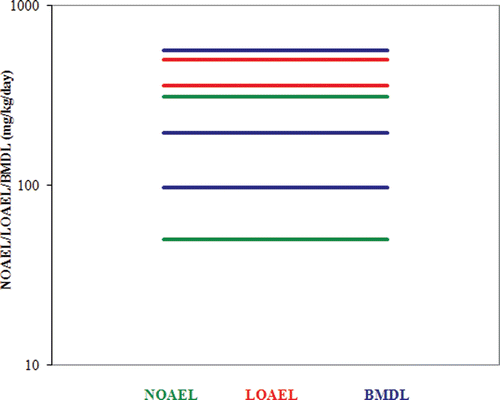
Table 42. Integration of noncancer effects by administered dose of DEHP.
Figure 13. Cumulative distribution of exposure to DEHP in females aged 7 to 75 based on reverse dosimetry of the biomonitoring data published in NHANES III.
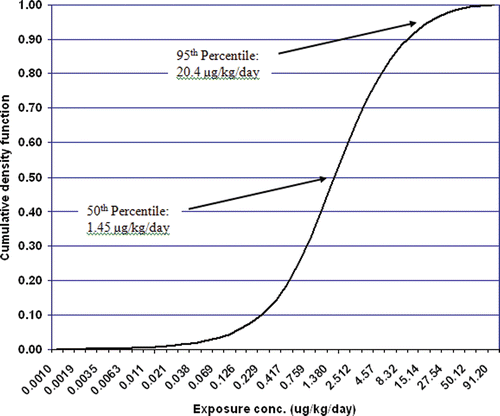
Table 43. Exposure distribution for females aged 7 to 75 as determined from reverse dosimetry using the DEHP PBPK model.
Figure B1. Free MEHP in the blood of the adult male rat after an iv dose of 20 or 50 mg/kg MEHP. Lines indicate model simulations. Points represent measurements from individual animals administered (•) 20 mg/kg MEHP (Sjoberg et al., Citation1985), (▾) 50 mg/kg MEHP (Pollack et al., Citation1985), or (Δ) 50 mg/kg MEHP (Kessler et al., Citation2004).
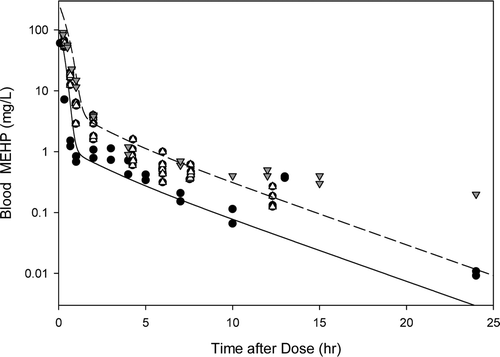
Figure B2. Free MEHP in the (A) blood of adult male rat after an oral dose of 70, 100, or 400 mg/kg MEHP or (B) excreta of adult male rat after an oral dose of 70 mg/kg MEHP. (A) Lines indicate model simulations. Points represent measurements from individual animals administered (o) 70 mg/kg MEHP (Chu et al., Citation1978), (▪) 100 mg/kg MEHP (Pollack et al., Citation1985), or (•) 400 mg/kg MEHP (Teirlynck and Belpaire, Citation1985). (B) Bars represent model simulations (gray) or mean + SD of measured (black) MEHP in the urine and feces rats administered 70 mg/kg MEHP (Chu et al., Citation1978).
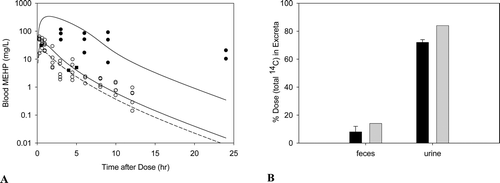
Figure B3. Free MEHP in the blood of adult rats after an (A)iv dose of 100 mg/kg DEHP, or (B) oral dose of 30, 300, or 500 mg/kg DEHP. Line indicates model simulation. Points represent measurements from individual animals administered (A) 100 mg/kg DEHP iv (Kessler et al., Citation2004) or (B) (o) 30 mg/kg, (Δ) 300 mg/kg, or (•) 500 mg/kg DEHP po (Kessler et al., Citation2004).
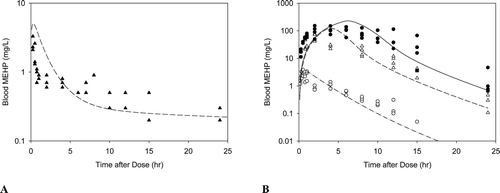
Figure B4. Free MEHP in the (A) maternal blood or (B) placenta and fetal tissues after the last oral dose of 30 or 500 mg/kg/day administered from GD 14 - 19. (A) Lines indicate model simulations. Points represent measurements from individual animals administered (•) 30 mg/kg/day or (o) 500 mg/kg/day DEHP po (Kessler et al., Citation2004). (B) Bars represent model simulations (black) or mean + SD of measured concentrations (gray) in the placenta and fetal tissues 2 hrs after the last daily dose of 500 mg/kg/day (Kessler et al., Citation2004).
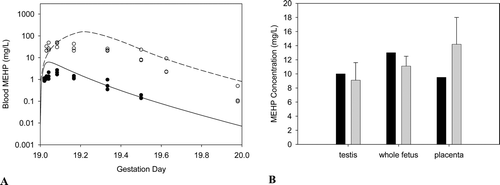
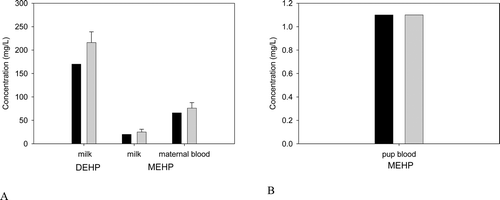
Figure B5. (A) DEHP and MEHP in the milk and MEHP in the blood of the lactating dam, and (B) MEHP in the suckling rat after the last oral dose of 2000 mg/kg/day administered on days 15− 17 of lactation. Bars represent model simulations (black) or mean + SD of measured concentrations (gray) in the milk, maternal blood and pup blood 3-6 hrs after the last dose of 2000 mg/kg/day DEHP (Dostal et al., Citation1987).
