Figures & data
Figure 1. Representation of histotypic liver microstructure. (A) Diagram of the basic hepatic lobule and acinus substructure showing the relative direction of blood flow from portal triads towards the central veins (red arrows). (B) Diagram illustrating the three-dimensional architecture of the liver between a portal triad and the central vein. The networks of bile canaliculi (yellow-green) run parallel and counter to the blood flow through the sinusoids.
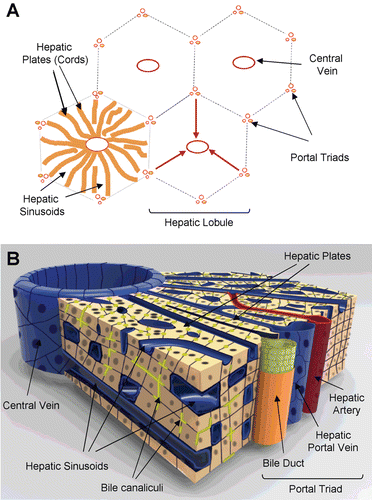
Figure 2. Structural and functional zonation of the liver. (A) Discrete zones of the liver between the portal vein (PV) and central vein (CV) illustrating the differences in cell size, phenotype and gradients in oxygen tension and metabolism. (B) Immunostaining of human liver tissue with antibodies again CYP3A4 (brown stain) showing the differential expression of CYP enzymes across the zones of the liver microstructure. The greatest expression of CYP enzymes is predominantly in pericentral hepatocytes (zone 3) with a distinct boundary or gradient at the mid-lobular region (zone 2).
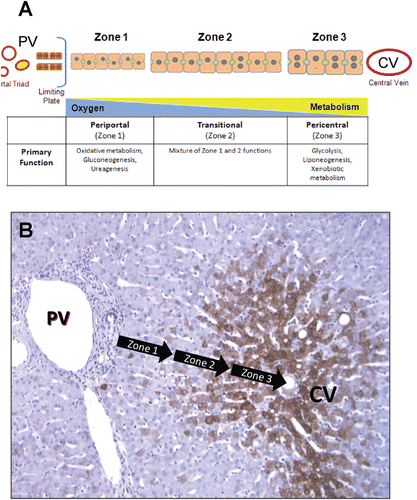
Figure 3. Histological and architectural structure of the liver parenchyma and endothelium. (A) Transmission electron micrograph of whole liver showing histotypic configuration and cytoarchitecture of hepatocytes (HC), including bile canaliculi (BC) and nucleoli (arrowhead). Sinusoids contain red blood cells (RBC) and resident macrophages (Kupffer cells, KC), and are lined with sinusoidal endothelial cells (LSEC). (B) Diagram illustrating the diverse morphological features of the mature hepatocyte including bile canaliculi, junctional complexes, and various subcellular organelles. Hepatocytes exhibit cellular polarity of subcellular organelles, cytoskeletal elements, and biochemical composition of membrane domains. BLD, basolateral domain; AD, apical domain; RER, rough endoplasmic reticulum; SER, smooth endoplasmic reticulum; Mito, mitochondria; Gly, glycogen granules; Lys, lysosomes; Sp Disse, space of Disse; Fen, fenestrations; ECM, extracellular matrix; GJIC, gap junction intercellular communication; Desm, desmosome; AJ, adherence junction; TJ, tight junction; BC, bile canaliculi; LSEC, liver sinusoidal endothelial cell.
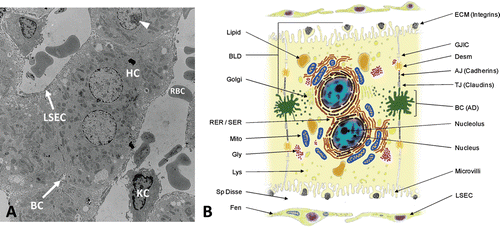
Figure 4. Cellular structures involved in cell-cell and cell-matrix interactions. (A) Ultrastructural composition of junctional complexes between adjacent hepatocytes. Intercellular adhesions between the basolateral (sinusoidal) and apical (canalicular) domains of adjoining hepatocytes are composed of a series of three distinct types of junctions: the tight junction (TJ), the adherens junction (AJ) and the desmosomal belt (D). (B) Diagram illustrating the adhesion molecules and associated proteins and pathways that mediate hepatocyte interactions with each other (claudins/occludins, cadherins, connexins) and the extracellular matrix (integrins). (Modified from D. Dostal, Ph.D., Div. of Mol. Cardiology, Texas A&M Health Science Center.)
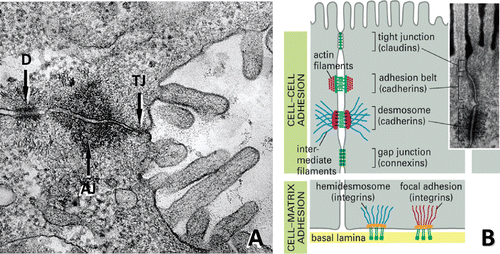
Figure 5. Major nonparenchymal cell types of the liver. Top row: CD-31 staining of liver sinusoidal endothelial cells (LSEC) lining vascular walls of whole liver (A), scanning electron micrograph of the endothelial lining of the liver sinusoids showing extensive patches of fenestrae (arrows) (B), and primary LSEC showing typical morphology in vitro (C). Middle row: HSC (GFAP) in normal liver (D), myofibroblastic HSC (µSMA) in fibrotic liver (E), and isolated qHSC showing storage of vitamin A as bright “floating” vesicles within the cell body. Upon activation or injury the HSC undergo extensive morphological and biochemical changes, which include the synthesis, secretion and restructuring of ECM molecules. Bottom row: Kupffer cells (KC) showing their dynamic morphology (G), their identification with CD68 showing extended projections on the cell bodies used for contact with other cells (H), and a magnified view showing KC loaded with vesicles containing cytokines and other secretory factors (I).
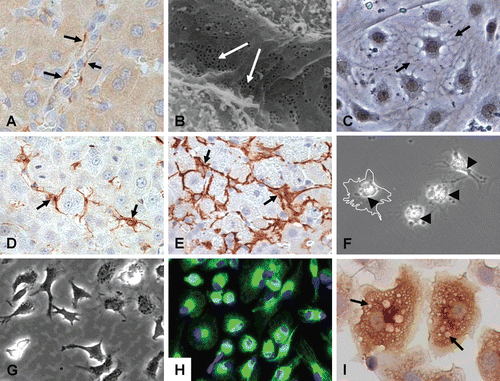
Figure 6. Representative cell types of the liver and their corresponding autocrine and paracrine signals that are secreted in both health and disease.
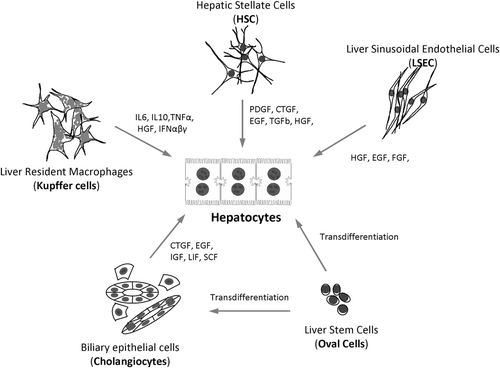
Figure 7. Diagram representing the zonal differences in lineage biology of hepatocytes, as well as the corresponding zonal differences in extracellular matrix chemistry. The stem cell compartment is located in the portal triad region associated with the Canals of Hering (see section “Hepatic progenitor cells”). These pluripotent stem cells can be stimulated to differentiate into either bile duct epithelial cells (cholangiocytes) or parenchymal cells (hepatocytes). The cellular and biochemical composition of the different zones of the liver between the portal triad and central vein is partially determined by the chemical make-up of the Space of Disse as well as other factors in the microenvironment, such as other cell types, oxygen, nutrients, and endogenous/endogenous substrates. PV, portal vein; HA, hepatic artery; LAM, laminin; FN, fibronectin; CS, chondroitin sulfate; HS, heparan/heparin sulfate.
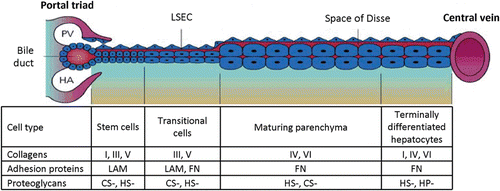
Table 1. Functional and histotypic markers of the different cell types that compose the liver microstructure.
Table 2. Comparison of organotypic models of the liver with respect to structural, functional and practical considerations.
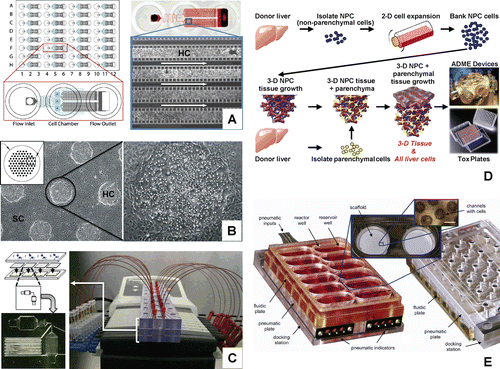
Figure 8. Hepatic cell culture model systems represented in “Advanced organotypic culture technologies”. (A) Perfusion array liver system (PEARL) (CitationLee et al., 2007), (B) bioengineered micropatterned liver platform (CitationKhetani and Bhatia, 2008), (C) biochip dynamic flow system (CitationChao et al., 2009; CitationNovik et al., 2010; CitationMaguire et al., 2009), (D) 3-D liver tissue culture scaffold (CitationSibanda et al., 1993; CitationSibanda et al., 1994; Naughton et al., Citation1994), and (E) 3-D scaffolds with dynamic flow (CitationSivaraman et al., 2005; CitationDomansky et al., 2010).