Figures & data
Table 1. Summary of Cr-induced DNA lesions.
Table 2. In vivo genotoxicity studies with Cr(VI)*.
Figure 1. Intestinal structure: (A) diagram of small intestine showing crypts, villi, and vasculature. The arrows show the migration of enterocytes from the crypts below the luminal surface to the tips of villi where enterocytes are sloughed into the intestinal lumen and (B) scanning electron micrograph of small intestine showing villi and mucus (© Unlisted Images / Fotosearch.com).
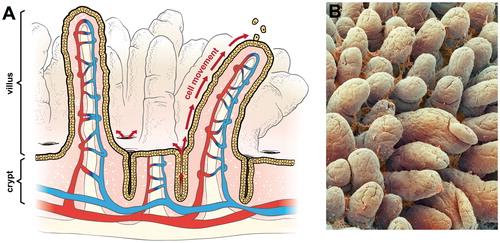
Table 3. Incidence of intestinal lesions in female rodents of NTP (Citation2008b) bioassay†.
Figure 2. Proposed MOA for Cr(VI) carcinogenesis in the small intestine.
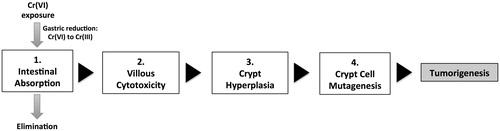
Figure 3. Total chromium (Cr) tissue concentration in alimentary canal: (A) total Cr levels in mice at day 91; data plotted are mean ± SEM. Total Cr was significantly (p < 0.01) elevated in all four tissues at ≥60 mg/l SDD by Shirley’s test, and in the duodenum at ≥14 mg/l SDD by Shirley’s test and (B) comparison of duodenal total Cr levels in mice (same data as in A) and the predicted exceedance of Cr(VI) reductive capacity by mouse gastric fluid in ex vivo experiments (Proctor et al., Citation2012). Bars represent the percentage of reductive capacity (left axis) and red line represents mean ± SEM duodenal Cr (right axis). (A) is plotted in terms of mg/l SDD, whereas (B) is plotted in terms of mg/l Cr(VI). *Significantly (p < 0.01) elevated Cr in duodenum by Shirley’s test.
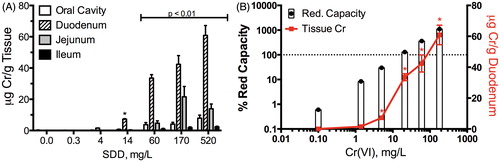
Figure 4. Quantitative assessment of intestinal structure in mice. (A) Duodenum of mouse exposed to 520 mg/l SDD for 90 days: with villous atrophy, blunting and fusion (arrow) and crypt epithelial hyperplasia, (B) duodenum of mouse exposed to 520 mg/l SDD for 90 days: with histiocytic cellular infiltration of the villous lamina propria (arrows) and cytoplasmic vacuolization of the villous epithelium, (C) representative image of crypt area analysis in (D)–(E), (D) measures of crypt area in three contiguous tissue sections at day 91 (*p < 0.05 by ANOVA/Dunn’s), (E) villus/crypt area ratios at days 8 and 91 (*p < 0.05 by ANOVA/Dunnett’s), (F) number of enterocytes per crypt at day 91 (10 full crypts assessed per animal; p < 0.01 by ANOVA/Dunnett’s), (G) representative image of crypt enterocyte analysis in (F) and , and (H) fold change in Ki67 expression at days 8 and 91 of exposure (dotted line represents 1.5-fold).
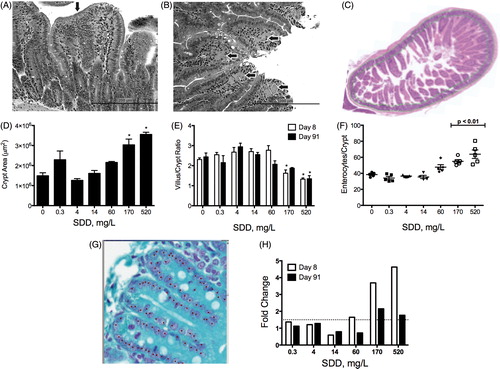
Table 4. Summary of intestinal histopathology in B6C3F1 mice.
Table 5. Total number of aberrant nuclei in fully intact duodenal crypts.
Table 6. Total number of aberrant nuclei in duodenal mucosal sections.
Figure 5. Redox changes in the intestine at day 8 (A) and day 91 (B). The left axis represents the GSH/GSSG ratio and the right axis shows the fold-change in gene expression. Gsr, glutathione reductase; Gpx, glutathione peroxidase. *Statistically significant decrease in GSH/GSSG ratio by Shirley’s test; **statistically significant increase (>1.5-fold, P1(t) > 0.999) relative to control by empirical Bayes’ method for posterior probabilities. (C) Heat map of DNA repair genes in mouse duodenum at days 8 and 91. Adapted from Kopec et al. (Citation2012a).
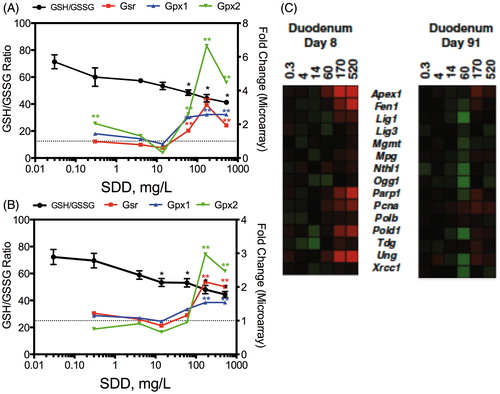
Figure 6. Mutagenicity analysis: (A) Kras codon 12 GGT to GAT mutation frequency (MF) in mouse duodenum assessed by ACB-PCR. The base 10 log of codon 12 GAF MF is plotted relative to the base 10 log of SDD concentration in mg/l. Error bars indicate the standard error of the geometric mean MF and (B) cluster analysis of expression values of 116 genes from four mutagenic (triangles) and four nonmutagenic (squares) carcinogens. The inner ellipse is the standard variance ellipse, and the outer ellipse is the 95% confidence boundary. The square with crosshair represents Cr(VI), indicating that the expression profile for Cr(VI) clusters more closely with nonmutagenic compounds (see text for further details). The four mutagenic carcinogens are 2-nitrofluorene, dimethylnitrosamine, 4-(methylnitrosamino)-1-(3-pyridyl)-1-butanone and aflatoxin B1; the four nonmutagenic carcinogens are methapyrilene, diethylstilbestrol, Wy-14643 and piperonylbutoxide. Panel B is adapted from Thompson et al. (Citation2012b).
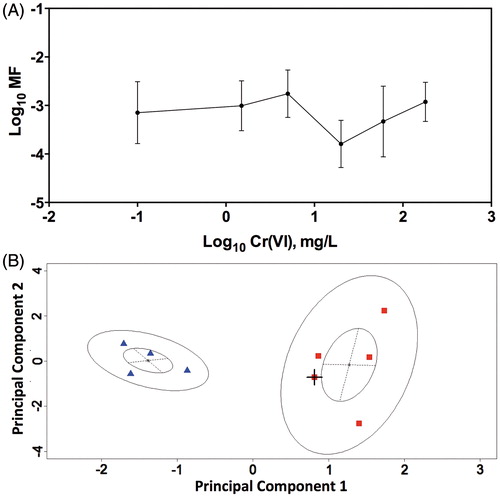
Figure 7. MN formation in CHO-K1 (A) and A549 (B) cells. Cells were treated with the indicated concentrations of Cr(VI). MN formation in bi-nucleated cells is shown in the larger plots. The insets show cytotoxicity as indicated by decrease in the number of bi-nucleated cells. Data represent mean ± SEM, n = 9.
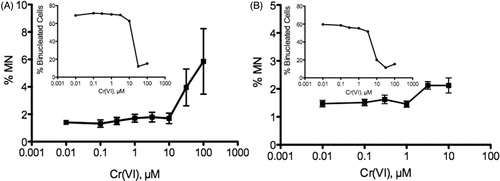
Figure 8. Nuclear staining intensity of 8-OHdG (open bars) and γ-H2AX (filled bars) in Caco-2 after 24-h treatment with Cr(VI): (A) undifferentiated Caco-2: 8-OHdG was significantly elevated at ≥0.3 µM; γ-H2AX was significantly elevated at ≥3 µM (cytotoxic concentrations) and (B) differentiated Caco-2: 8-OHdG and γ-H2AX were significantly elevated at ≥30 µM (8-OHdG was also elevated at 0.3 µM). Nuclear staining represents mean ± SEM (n = 3); Cell # = mean ± SD (n = 3).
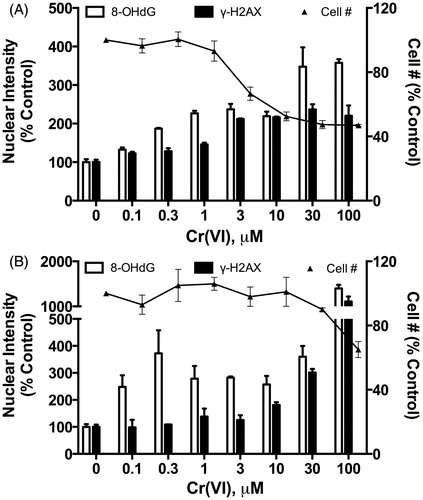
Figure 9. Dose concordance: (A) dose–response of effects in the mouse duodenum at day 8, (B) dose–response of effects in the mouse duodenum at day 91 and (C) dose–response of effects in the mouse jejunum at day 91.
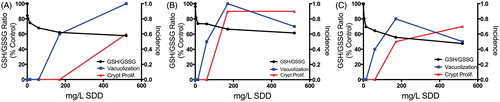
Figure 10. Comparison of key events in the 90-day MOA study and the NTP 2-year bioassay. The term “diffuse hyperplasia” includes both villous toxicity and crypt hyperplasia. Together, these studies establish that villous cytotoxicity is an antecedent to tumor formation in the mouse small intestine. This illustration is patterned after a generalized scheme in Meek & Klaunig (Citation2010).
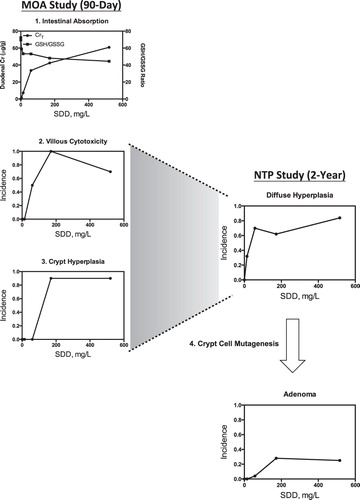
Table 7. Temporal concordance.
Table 8. US EPA mutagenic framework and application to Cr(VI) in the small intestine.
Table 9. Select properties of mutagenicity as key events and application to the Cr(VI) in the small intestine.
Table 10. Concordance table for human relevance.