Figures & data
Table I. Overview of prognostic markers in CLL.
Figure 1. Different molecular mechanisms driving IGHV-mutated and unmutated CLL. An illustration of the most important genetic, RNA and protein based prognostic markers in relation to the IGHV gene mutational status. NOTCH1 activating mutations and BIRC3 disrupting mutations lead to enhanced NF-κB signaling and proliferation in IGHV-unmutated CLL. ZAP70 is involved in BcR signaling and its overexpression leads to enhanced proliferation through, e.g. NF-κB signaling. Disruption of TP53 through deletion and/or mutation is more common in IGHV-unmutated CLL and leads to dysfunctional cell cycle arrest resulting in enhanced cell survival. Although the reason for higher LPL and CLLU1 expression in CLL is unknown, these markers are correlated to high risk.
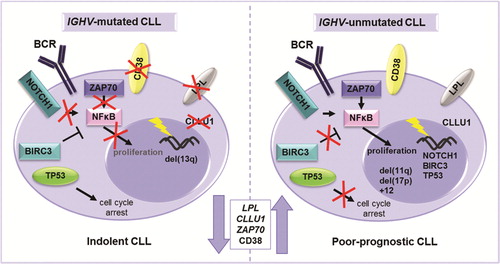
Figure 2. Overall survival in patients according to known recurrent aberrations (A) and in relation to increasing genomic complexity (B) in a population-based Scandinavian CLL cohort.
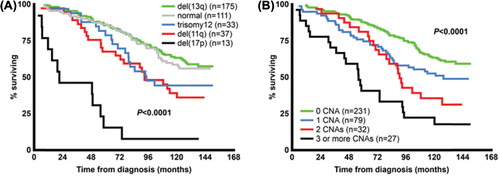
Figure 3. Prognostic impact of TP53 aberrations, NOTCH1 and SF3B1 mutations on overall survival and time to treatment in newly diagnosed CLL. For analysis of overall survival (A), six cases with concurrent del(17p) and NOTCH1 or SF3B1 mutations were included in the “TP53 aberration” subgroup, whereas for time to treatment analysis (B), five cases included in the “TP53 aberration” subgroup also displayed NOTCH1 or SF3B1 mutations. There were no statistically significant differences when comparing the TP53 aberration subgroup to either NOTCH1 or SF3B1 mutation subgroups for either overall survival or time to treatment.
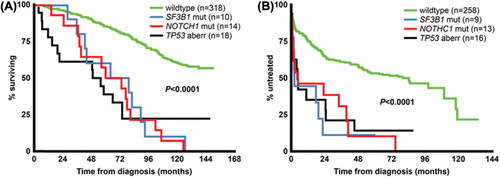
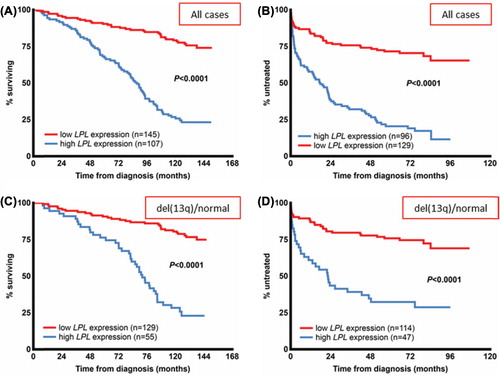
Figure 4. LPL expression status and clinical outcome in CLL. Overall survival (A) and time to treatment (B) according to LPL expression status in a newly diagnosed population-based CLL cohort. (C, D) Patients with good cytogenetic markers, i.e. absence of the known recurrent genomic aberrations or presence of del(13q) from the same cohort. In the patient group with good-risk cytogenetic markers, overall survival (C) and time to treatment (D) are stratified by LPL expression status. The expression cut-off for LPL was defined using receiver operating characteristic (ROC) curve analysis and median survival.