Figures & data
Figure 1. Heat map of miRNA microarray expression data in granulocytes of peripheral blood from patients with AML (n = 4) and healthy controls (n = 4). The expression of miRNA is hierarchically clustered on the y-axis, and AML granulocyte samples or healthy control granulocyte samples are hierarchically clustered on the x-axis. Legend on the right indicates miRNA represented in the corresponding row. Relative miRNA expression is depicted according to the color scale shown on the right. Red indicates up-regulation, green down-regulation. Numbers A1, A2, A3, A4 indicate AML patient samples; numbers B1, B2, B3, B4 indicate healthy control samples.
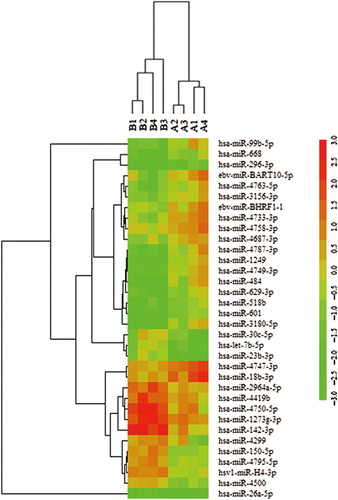
Table I. Properties of microRNAs differentially expressed in patients with AML compared with healthy control subjects.
Figure 2. Validation of miRNA microarray data by quantitative reverse transcription-polymerase chain reaction. The microarray cohort included four patients with AML and four healthy controls. Relative expression of five miRNAs was normalized to expression of the internal control (U6). p-Values were calculated by two-sided Student's t-test. *p < 0.05; **p < 0.01 and ***p < 0.001.
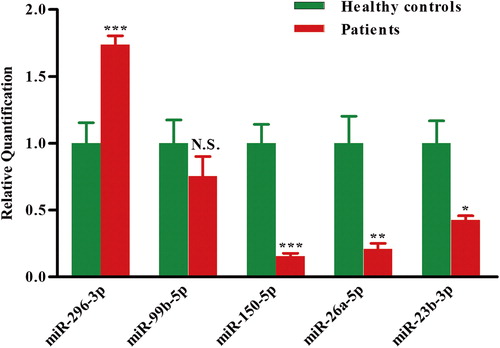
Figure 3. Independent validation of differential expression of miRNA in patients with AML. Quantitative reverse-transcription polymerase chain reaction for two miRNAs, (A) miR-26a-5p and (B) miR-23b-3p, in an independent validation set of 20 patients with AML and 12 healthy controls. Relative expression of each miRNA in patients with AML compared with healthy controls was normalized to human U6 expression. Horizontal lines indicate medians. p-Values (p < 0.0001) were calculated by Student's t-test.
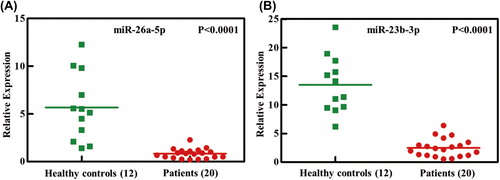
Figure 4. PrxIII is a direct target of both miR-26a-5p and miR-23b-3p. (A) HEK293 cells were transfected with miRNA inhibitors specific for miR-26a-5p, miR-23b-3p and miR-26a-5p + miR-23b-3p. Equivalent amounts (30 μg) of whole-cell lysates were separated by SDS-PAGE and analyzed by immunoblotting with antibodies specific for the indicated proteins. (B) HEK293 cells were transfected with miRNA mimics specific for miR-26a-5p, miR-23b-3p and miR-26a-5p + miR-23b-3p. Equivalent amounts (30 μg) of whole-cell lysates were separated by SDS-PAGE and analyzed by immunoblotting with antibodies specific for the indicated proteins. (C) Compiled data of PrxIII protein analysis from three independent experiments after transfection of miRNAs is shown. Columns, mean; bars, ± SD; *p < 0.05, **p < 0.01. (D) Compiled data of PrxIII mRNA analysis from three independent experiments after transfection of miRNAs is shown. Columns, mean; bars, ± SD; **p < 0.01, ***p < 0.001. (E) Predicted human PrxIII-encoded mRNA contains a 3’-UTR element that is partially complementary to the indicated miRNAs. Above: predicted target binding sites for miR-26a-5p and miR-23b-3p, respectively. Below: predicted duplex combination between human PrxIII 3’-UTR-wt/mut and miR-26a-5p, PrxIII 3’-UTR-wt/mut and miR-23b-3p. (F) Luciferase activity of pmirGLO3-PrxIII-wt or pmirGLO-PrxIII-mut in HEK293 cells after miR-26a-5p and miR-23b-3p transfections. Data are shown as mean ± SD based on three independent experiments, *p < 0.05, **p < 0.01.
Figure 5. miR-26a-5p and miR-23b-3p repressed PrxIII expression in K562 cells and granulocytes from patients with AML. (A) K562 cells were transfected with miRNA inhibitors (left) and mimics (right) specific for miR-26a-5p or miR-23b-3p. Equivalent amounts (30 μg) of whole-cell lysates were separated by SDS-PAGE and analyzed by immunoblotting with antibodies specific for the indicated proteins. (B) PrxIII mRNA analysis from three independent experiments after transfection of miRNAs is shown. Columns, mean; bars, ± SD; **p < 0.01, ***p < 0.001. (C) Equivalent amounts (35 μg) of whole-granulocyte lysates from 11 untreated patients with AML and six healthy controls were separated by SDS-PAGE and analyzed by immunoblotting with antibodies specific for the indicated proteins. (D) Relative expression of PrxIII in patients with AML compared with healthy controls was normalized to GAPDH expression. Columns, mean; bars, ± SD; **p < 0.01. (E) Transfection with indicated siRNA and miRNA inhibitors. Equivalent amounts (30 μg) of whole-cell lysates were separated by SDS-PAGE and analyzed by immunoblotting with antibodies specific for the indicated proteins.
Figure 6. miR-26a-5p and miR-23b-3p decrease levels of ROS. (A) HEK293 and K562 cells transfected with control, miR-mock, miR-26a-5p inhibitor and miR-23b-3p inhibitor were labeled with DCFH-DA and analyzed by flow cytometry. A representative histogram (green, red and blue lines indicate ROS production in transfection of miR-mock, miR-26a-5p inhibitor and miR-23b-3p inhibitor, respectively) is shown. (B) DCFH-DA fluorescence measurements of cellular ROS levels in transfection of miR-mock, miR-26a-5p inhibitor and miR-23b-3p inhibitor in HEK293 or K562 cells. Columns, mean; bars, ± SD; *p < 0.05, **p < 0.01. Compiled data were produced from three independent experiments. (C) HEK293 and K562 cells transfected with control, miR-mock, miR-26a-5p mimic and miR-23b-3p mimic were labeled with DCFH-DA and analyzed by flow cytometry. A representative histogram (green, red and blue lines indicate ROS production in transfection of miR-mock, miR-26a-5p mimic and miR-23b-3p mimic, respectively) is shown. (D) DCFH-DA fluorescence measurements of cellular ROS levels in transfection of miR-mock, miR-26a-5p mimic and miR-23b-3p mimic in HEK293 or K562 cells. Columns, mean; bars, ± SD; *p < 0.05, **p < 0.01, ***p < 0.01. Compiled data were produced from three independent experiments. (E) HEK293 and K562 cells transfected with control, miR-mock, miR-26a-5p inhibitor + siPrxIII and miR-23b-3p inhibitor + siPrxIII were labeled with DCFH-DA and analyzed by flow cytometry. A representative histogram (green, red and blue lines indicate ROS production in transfection of miR-mock, miR-26a-5p/miR-23b-3p inhibitor and miR-26a-5p/miR-23b-3p inhibitor + siPrxIII, respectively) is shown. (F) DCFH-DA fluorescence measurements of cellular ROS levels in transfection of miR-mock, miR-26a-5p/miR-23b-3p inhibitor and miR-26a-5p/miR-23b-3p inhibitor + siPrxIII in HEK293 cells. Columns, mean; bars, ± SD; *p < 0.05. Compiled data were produced from three independent experiments.
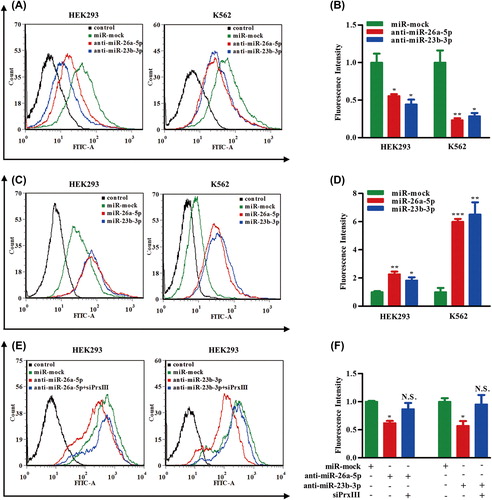
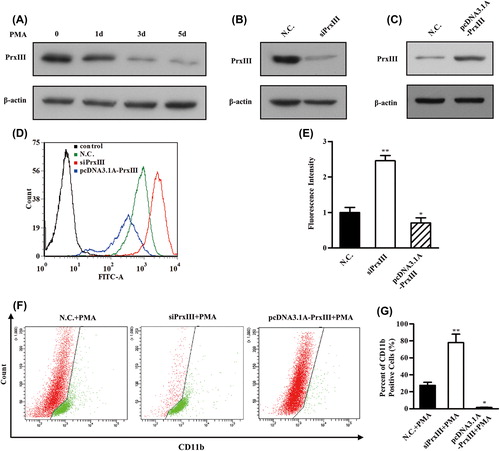
Figure 7. PrxIII responsible for ROS production and K562 cell differentiation. (A) K562 cells were induced by PMA. Equivalent amounts (30 μg) of whole-cell lysates were extracted at several time points (0 day, 1 day, 3 days and 5 days), separated by SDS-PAGE and analyzed by immunoblotting with antibodies specific for the indicated proteins. (B, C) Transfection with the indicated siRNA and plasmid. Equivalent amounts (30 μg) of whole-cell lysates were separated by SDS-PAGE and analyzed by immunoblotting with antibodies specific for the indicated proteins. (D) K562 cells transfected with siPrxIIII, pcDNA3.1A-PrxIII and control were labeled with DCFH-DA and analyzed by flow cytometry. A representative histogram (green, red and blue lines indicate ROS production in transfection of normal control (N.C.), siPrxIII and pcDNA3.1A-PrxIII, respectively) is shown. (E) DCFDA fluorescence measurements of cellular ROS levels in transfection of N.C., siPrxIII and pcDNA3.1A-PrxIII in K562 cells, respectively. Columns, mean; bars, ± SD; *p < 0.05, **p < 0.01. Compiled data were produced from three independent experiments. (F) Representative CD11b fluorescence measurements of differentiation percentage in transfection of N.C., siPrxIII and pcDNA3.1A-PrxIII in K562 cells, respectively. (G) CD11b positive percentage of differentiation in transfection of N.C., siPrxIII and pcDNA3.1A-PrxIII in K562 cells, respectively. Columns, mean; bars, ± SD; **p < 0.01. Compiled data were produced from three independent experiments.