Figures & data
Figure 1. Both CSL360 and 7G3 effectively neutralize IL-3-induced proliferation (A) and signaling (B) in primary AML cells. (A) Primary AML cells (1 × 10⁵ cells), collected at diagnosis from non-CSL360 trial patients who provided informed consent for inclusion on another HREC-approved research study [Citation39], were cultured in RPMI/10% FCS and 10 ng/mL IL-3 in the presence of increasing concentrations of CSL360 or 7G3 for 48 h at 37°C. Cell proliferation was determined by measuring 3[H]-thymidine incorporation. The mean and SEM of proliferation as a percentage of control (IL-3 alone) from four different AML patient samples are shown. (B) Primary AML cells (1 × 10⁵ cells) were incubated with 10 μg/mL CSL360 or 7G3 for 15 min prior to stimulation with 10 ng/mL IL-3 for a further 15 min at 37°C. The percentage of pSTAT5-positive blasts was determined by flow cytometry.
![Figure 1. Both CSL360 and 7G3 effectively neutralize IL-3-induced proliferation (A) and signaling (B) in primary AML cells. (A) Primary AML cells (1 × 10⁵ cells), collected at diagnosis from non-CSL360 trial patients who provided informed consent for inclusion on another HREC-approved research study [Citation39], were cultured in RPMI/10% FCS and 10 ng/mL IL-3 in the presence of increasing concentrations of CSL360 or 7G3 for 48 h at 37°C. Cell proliferation was determined by measuring 3[H]-thymidine incorporation. The mean and SEM of proliferation as a percentage of control (IL-3 alone) from four different AML patient samples are shown. (B) Primary AML cells (1 × 10⁵ cells) were incubated with 10 μg/mL CSL360 or 7G3 for 15 min prior to stimulation with 10 ng/mL IL-3 for a further 15 min at 37°C. The percentage of pSTAT5-positive blasts was determined by flow cytometry.](/cms/asset/ed05201b-5592-4a9e-97a7-147d76035971/ilal_a_956316_f0001_b.gif)
Table I. Patient characteristics.
Table II. Summary of grade ≥ 3 adverse events occurring in > 1 patient.
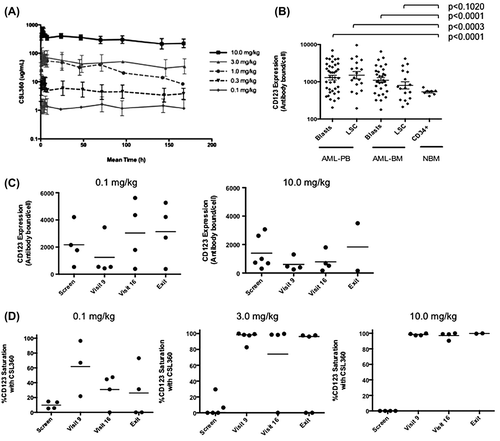
Figure 2. Steady-state exposure of CSL360 and its effects on CD123 expression and saturation in vivo. (A) Mean serum CSL360 concentration–time profile following the fourth dose administration. Mean and SD are shown for all five dose cohorts. (B) The level of CD123 expression was quantitated on the blasts and LSC population of all patients at screening and in CD34 + cells from normal bone marrow (NBM). Ficoll-separated mononuclear cells from PB were stained with a cocktail consisting of CD45, CD34, CD38 and CD123. Blasts were identified based on a low SSC/CD45dim phenotype and the LSC enriched population was defined as CD34+/CD38−. (C) CD123 expression is down-regulated by exposure to CSL360 in vivo. The expression of CD123 on PB blasts at day 16 (visit 9), day 29 ± 3 (visit 16) and where available study exit, from selected patients was measured using 9F5 and is represented as antibodies bound/cell. Data from the 0.1 mg and 10 mg/kg cohorts are shown, and a reduction was observed in all cohorts (not shown). (D) CD123 saturation by CSL360 in PB blasts demonstrated by the absence of 7G3 binding in the presence of 9F5 binding in 0.1, 3.0 and 10.0 mg/kg cohorts is shown. Individual patient data and the mean are represented.

Figure 3. Plasma concentrations of CSL360 at higher dose cohorts are sufficient to inhibit IL-3-induced proliferation of patient mononuclear cells ex vivo. Ficoll-separated mononuclear cells from patient PB or BM taken at day 16 (1 day post-dose 3) were cultured for 48 h at 37°C in increasing concentrations of IL-3 in the presence (black circles) or absence (gray circles) of 10% autologous plasma collected on the same day. Proliferation was measured by incorporation of 3[H]-thymidine. Each plot represents a single patient from cohort 1 (A), 2 (B), 4 (C) or 5 (D). The mean of triplicate measurements is shown.
![Figure 3. Plasma concentrations of CSL360 at higher dose cohorts are sufficient to inhibit IL-3-induced proliferation of patient mononuclear cells ex vivo. Ficoll-separated mononuclear cells from patient PB or BM taken at day 16 (1 day post-dose 3) were cultured for 48 h at 37°C in increasing concentrations of IL-3 in the presence (black circles) or absence (gray circles) of 10% autologous plasma collected on the same day. Proliferation was measured by incorporation of 3[H]-thymidine. Each plot represents a single patient from cohort 1 (A), 2 (B), 4 (C) or 5 (D). The mean of triplicate measurements is shown.](/cms/asset/d6caa4c8-564d-41be-ba67-f82724c3d615/ilal_a_956316_f0003_b.gif)
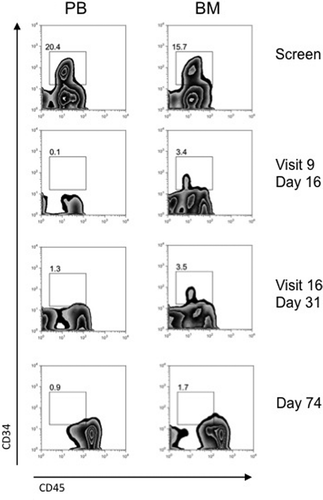
Figure 4. Flow cytometry profile of PB and BM of subject AWM002 indicating sustained clearance of the blast population from day 16. Ficoll-separated mononuclear cells from patients taken at screening, day 16 (visit 9: 1 day post-dose 3), day 31 (visit 16: 10 days post-dose 4) and day 74 (post-dose 12) were analyzed by fluorescence activated cell sorting (FACS). AML blasts were identified by gating on the CD45dim/CD34 + population.

