Figures & data
Fig. 1. Immunogold labeled T. forsythensis cells. Control section without antigen retrieval treatment. Cytoplasmic membrane (CM) and outer membrane (OM) consisted of two electron-dense layers. Serrated subunits of S-layer (S) are shown.
Fig. 2. Low (b, d) and high (a, c, e) magnification micrographs of immunogold-labeled T. forsythensis cells after antigen retrieval by heating with the autoclave. a) Autoclaved at 115˚ C with 1% citraconic anhydride. b and c) Autoclaved at 132˚ C with distilled water. d and e) Autoclaved at 132˚ C with 1% citraconic anhydride. Moderately decreased cytoplasm (a, b, d) compared to control cytoplasm () without damage to the ultrastructural integrity of the cytoplasmic membrane and outer membrane (c, e). Immunogold-particles in a, c, e showed greater reactivity than the control (). CM, cytoplasmic membrane; OM, outer membrane; S, S-layer.
Fig. 3. Low (a, c) and high (b, d) magnification micrographs of immunogold-labeled T. forsythensis cells after antigen retrieval by heating with the microwave oven. Microwaved at 100˚ C with 1% citraconic anhydride. Moderately decreased cytoplasm (a, c) compared to control cytoplasm () without damage to the ultrastructural integrity of cytoplasmic membrane and outer membrane (b, d). Immunogold-particles in (b) and (d) showed greater reactivity than the control (). CM, cytoplasmic membrane; OM, outer membrane; S, S-layer.
Fig. 4. ESI and parallel-EELS analysis showed the distribution of nitrogen in the cytoplasm of T. forsythensis without microwave treatment at 100˚ C; cells only. A small amount of endogenous nitrogen was observed in the cytoplasm. a) Zero-loss transmission image. b) Background removed net ∆Emax 410 eV. c) Parallel-EELS analysis of the circled area of Fig. 4b. d) The second window of ∆Ew2 350 eV. e) The first window of ∆Ew1 382 eV of nitrogen. f) ∆Emax 410 eV of K edge of nitrogen.
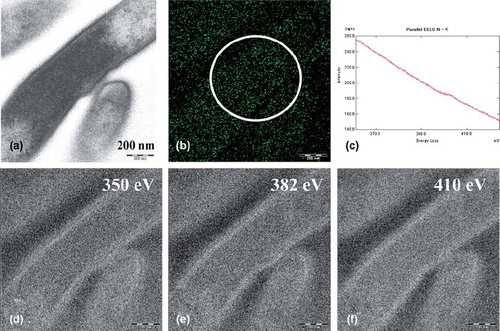
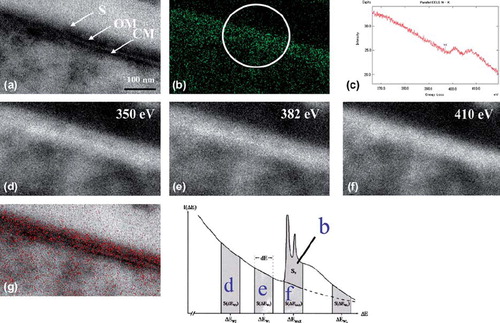
Fig. 5. ESI using three-window method and parallel-EELS for T. forsythensis cells incubated in DAB medium with H2O2 and DAB. Nitrogen distribution corresponded to the outermost cell surface, the S-layer. a) Zero-loss transmission image. b) Background removed net ∆Emax 410 eV. c) Parallel-EELS analysis of the circled area in Fig. 5b. d) The second window of ∆Ew2 350 eV t. e) The first window of ∆Ew1 382 eV of nitrogen. f) ∆Emax 410 eV of K edge of nitrogen. g) Superimposed image of nitrogen distribution over the zero-loss image. CM, cytoplasmic membrane; OM, outer membrane; S, S-layer.