Figures & data
Figure 1. Chemical structures of vitamin E (tocopherols and tocotrienols).
Figure 2. Vitamin E prevents cell death after treatment of neuro2a cells with hydrogen peroxide. Neuro2a cells were treated with α-tocopherol (5 μM), α-tocotrienol (5 μM) or γ-tocotrienol (5 μM) in the presence or absence of various concentrations of hydrogen peroxide. After 24 h, the number of dead neuro2a cells was counted by trypan blue dye exclusion assay. Each column represents the mean of results of three independent experiments. At least three wells were used per experiment. Data were analysed by Student's t-test, with findings of p < 0.01 considered significant.
Figure 3. Treatment of neuro2a cells with low concentrations of hydrogen peroxide induces neurite beading, which is prevented by vitamin E. Neuro2a cells were treated with α-tocopherol (5 μM), α-tocotrienol (5 μM) or γ-tocotrienol (5 μM) in the presence or absence of various concentrations of hydrogen peroxide. After 24 h, the cells were fixed with 4% PFA in PBS. Photomicrographs of the cells were taken and analysed on a personal computer. The scale bar is 10 μm. Arrows indicate beading on the degenerating neurites of neuro2a cells (A). The results of quantitative analysis of neurite beading are shown (B). Each column represents the mean of results of three independent experiments. At least three wells were used per experiment. Data were analysed by Student's t-test, with findings of p < 0.01 considered significant.
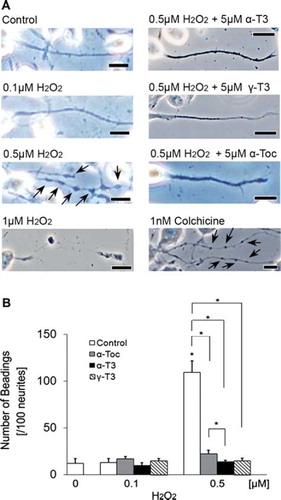
Figure 4. Denatured CRMP-2 proteins appear after treatment of neuro2a cells with hydrogen peroxide. Neuro2a cells after treatment with hydrogen peroxide in the presence or absence of α-tocotrienol (5 μM) or γ-tocotrienol (5 μM) were lysed and used for western blotting analysis. The same membranes were re-probed and used for the detection of β-actin (A). CRMP-2 band intensities were calculated using ImageQuant TL. Relative band intensities of total CRMP-2 protein are shown (B). Relative band intensities of denatured CRMP-2 protein are plotted as a ratio of the intensity of bands for total CRMP-2 protein. Control values were set to 100%. All scores are normalized to the band intensity of β-actin (C). Each column represents the mean of three independent experiments. Data were analysed by Student's t-test, with findings of p < 0.05 considered significant.
Figure 5. CRMP-2 protein is localized in regions of neurite beading in neuro2a cells. Immunohistochemical analysis of neuro2a cells using C4G antibody. Neuro2a cells were treated with each concentration of hydrogen peroxide (0.1, 0.5, 1 μM) in the presence or absence of α-tocotrienol (5 μM) or γ-tocotrienol (5 μM). After 24 h, the cells were fixed with 4% PFA solution. Phase-contrast (left) or fluorescence photomicrographs were taken (right). The scale bar is 10 μm. The method of immunohistochemical analysis is described in Materials and methods.
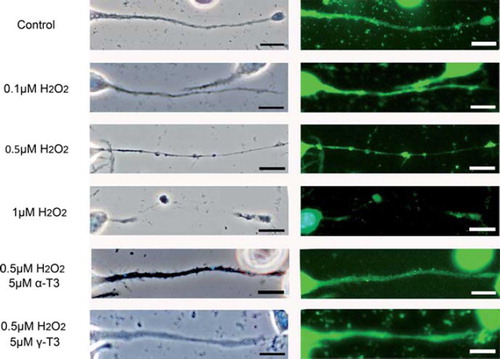
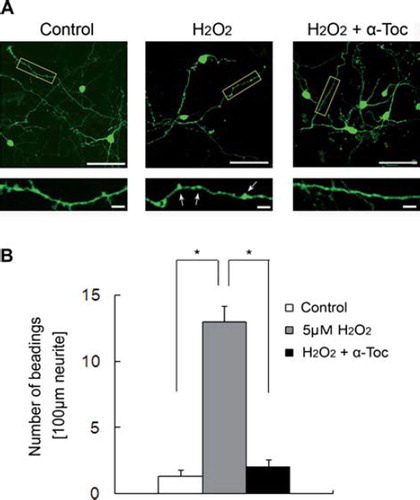
Figure 6. Neurite beading was induced by treatment of EGFP-transfected CGCs with hydrogen peroxide. (A) Each image was taken by confocal microscopy. After 18 h of transfection with EGFP, the CGCs were treated with 5 μM hydrogen peroxide in the presence or absence of 10 μM α-tocopherol. Magnified images represent the regions defined in the yellow box of each fluorescence photomicrograph. Arrows show beading along the neurites. The scale bar is 50 μm (upper panels) or 10 μm (lower panels). (B) The results of quantitative analysis of neurite beading in hydrogen peroxide-treated CGCs. Each column represents the mean of three independent experiments. Data were analysed by Student's t-test, with findings of p < 0.01 considered significant. The method of transfection is described in Materials and methods.