Figures & data
Figure 1. Measurement of vitamin E contents in cerebral cortex, cerebellum, and hippocampus. White column shows normal mice (3 month, n = 4; 6 month n = 4; 24 month n = 3) and black column shows vitamin E-deficient (E(‐), 3 month, n = 4; 6 month, n = 4). Details of sample preparation and experimental conditions are described in the Materials and methods.
Figure 2. Changes in CRMP-2 and pCRMP-2 expression in long-term vitamin E-deficient mice. Black column shows vitamin E-deficient (E(‐), 3 month, n = 4; 6 month, n = 9) and white column shows normal mice (3 month, n = 7; 6 month, n = 9; 24 month, n = 8). Details of sample preparation and experimental conditions are described in the Materials and methods. The ratio of total CRMP-2 band intensity to β-actin band intensity and the ratio of pCRMP-2 band intensity to CRMP-2 band intensity in the cerebral cortex, cerebellum, and hippocampus (A). Western blot analysis of pCRMP-2 and CRMP-2 (B). RT-PCR analysis of CRMP-2 mRNA expression (C). The left image shows CRMP-2 mRNA and the right image shows G3PDH. The ratio of CRMP-2 mRNA band intensity to G3PDH band intensity (D). Immunocytochemical analysis of CRMP-2 and pCRMP-2 in the presence or absence of hydrogen peroxide in neuro2a cells (E). Images were obtained by fluorescence microscopy. Neuro2a cells were treated with 0.1 and 0.5 μM hydrogen peroxide. After 24 h, the cells were fixed with 4% PFA in PBS. Photomicrographs of the cells were taken and analyzed in axonal regions using a personal computer. The scale bar is 10 μm. Arrows indicate beading of the degeneration of neuro2a cells. A minimum of three wells were used per experiment. The ratio in normal mice of 3 months of age in each region was set to 1. Each column represents the mean of three independent experiments. Data were analyzed using Student's t-tests, *indicates p < 0.05 and **indicates p < 0.01.
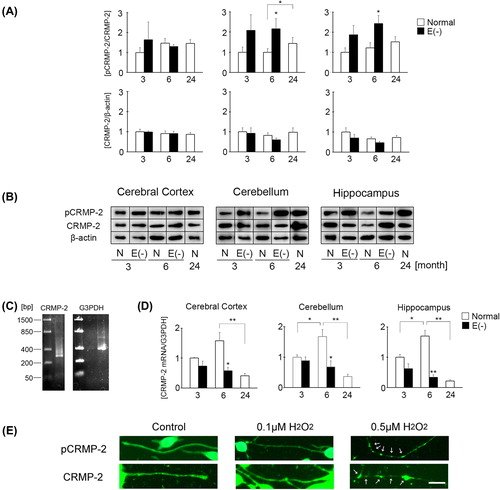
Figure 3. Changes in GSK-3β and pGSK-3β expression in long-term vitamin E-deficient mice. Black column shows vitamin E-deficient (E(‐), 3 month, n = 7; 6 month, n = 8) and white column shows normal mice (3 month, n = 9; 6 month, n = 9; 24 month, n = 8). Details of sample preparation and experimental conditions are described in the Materials and methods. The graph shows the ratio of total GSK-3β band intensity to β-actin band intensity and the ratio of pGSK-3β band intensity to GSK-3β band intensity in the cerebral cortex, cerebellum, and hippocampus (A). Western blot analysis of pGSK-3β and GSK-3β (B). The ratio in normal mice of 3 months of age in each region was set to 1. Each column represents the mean of three independent experiments. Data were analyzed using Student's t-tests, *indicates p < 0.05 and **indicates p < 0.01.
Figure 4. Changes in MAP LC3-1 and LC3-2 expression in long-term vitamin E-deficient mice. Black column shows vitamin E-deficient (E(‐), 3 month, n = 4; 6 month, n = 5) and white column shows normal mice (3 month, n = 7; 6 month, n = 4; 24 month, n = 4). Details of sample preparation and experimental conditions are described in the Materials and methods. The graph shows the ratio of total MAP LC3-1 band intensity to β-actin band intensity and the ratio of LC3-2 band intensity to β-actin band intensity in the cerebral cortex, cerebellum, and hippocampus (A). Western blot analysis of MAP LC3-1 (16 kDa) and LC3-2 (14 kDa) (B). The ratio in normal mice of 3 months of age in each region was set to 1. Each column represents the mean of three independent experiments. Data were analyzed using Student's t-tests, *indicates p < 0.05 and **indicates p < 0.01.
Figure 5. Changes in SIRT-2 mRNA expression in long-term vitamin E-deficient mice. Black column shows vitamin E-deficient (E(‐), 3 month, n = 4; 6 month, n = 4) and white column shows normal mice (3 month, n = 4; 6 month, n = 4; 24 month, n = 4). Details of sample preparation and experimental conditions are described in the Materials and methods. Panel (A) shows RT-PCR analysis of SIRT-2 mRNA expression. The results of agarose gel electrophoresis of SIRT-2(B). The left image shows SIRT-2 mRNA and the right image shows G3PDH. Panel (C) shows the ratio of SIRT-2 mRNA band intensity to G3PDH band intensity. The ratio in normal mice of 3 months of age in each region was set to 1. Each column represents the mean of three independent experiments. Data were analyzed using Student's t-tests, *indicates p < 0.05 and **indicates p < 0.01.
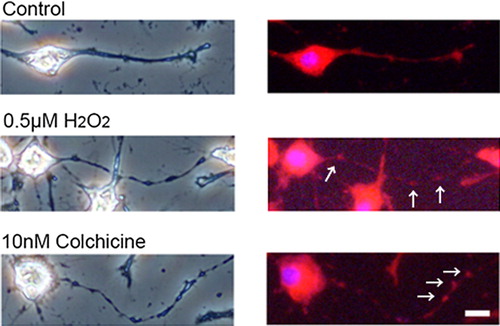
Figure 6. Localization of mitochondria in hydrogen peroxide-treated neuro2a cells. Neuro2a cells were treated with 0.5 μM of hydrogen peroxide. After 24 h, the cells were incubated with 200 μM Mito Tracker® for 15 min in CO2 incubator and were fixed with 4% PFA in PBS for 15 min in 4°C. In order to check the status of nucleus, 1 μM Hoechst 33258 was used as nucleus stain. For positive control sample, the cells were treated with 10 nM colchicine for 24 h. Phase-contrast (left) or fluorescence photomicrographs (right) were taken. Scale bar is 10 μm. The arrows show neurite beadings. The detailed method is described in Materials and methods.