1,246
Views
35
CrossRef citations to date
0
Altmetric
Research Article

Formulation of plumbagin loaded long circulating pegylated liposomes: in vivo evaluation in C57BL/6J mice bearing B16F1 melanoma

, , , , , , & show all
Pages 511-522 | Received 10 Nov 2010, Accepted 27 May 2011, Published online: 28 Jul 2011

Figures & data

Table 1.  Composition of liposomes and their respective particle size with zeta potential values.

Figure 1.  (A) Transmission electron micrograph of pegylated liposomes (C1) of PLB. (B) Encapsulation efficiency (%) of PLB. F1-F5 represents conventional, whereas C1 represents long circulating liposomes. (C) Effect of cholesterol on in vitro release profile of conventional (CH1-CH4) and long circulating liposomes (C1) in PBS at 37 °C (n = 3).
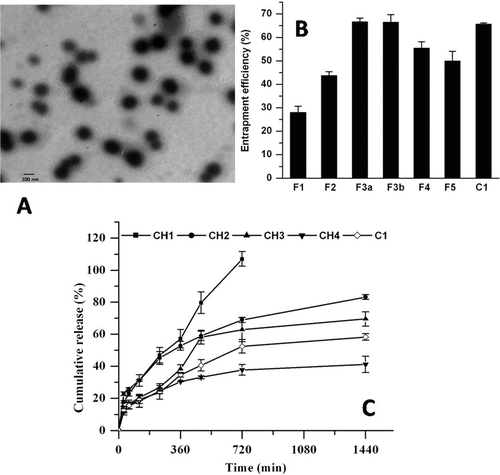
Figure 1.  (A) Transmission electron micrograph of pegylated liposomes (C1) of PLB. (B) Encapsulation efficiency (%) of PLB. F1-F5 represents conventional, whereas C1 represents long circulating liposomes. (C) Effect of cholesterol on in vitro release profile of conventional (CH1-CH4) and long circulating liposomes (C1) in PBS at 37 °C (n = 3).

Table 2.  Effect of cholesterol on physicochemical characteristics of liposomes.

Figure 2.  Physical stability of conventional (F3b) and long circulating liposomes (C1) in fetal bovine serum as a function of particle size up to 24 h incubation. Significant values: **p < 0.01 in comparison to particle size at initial time point.
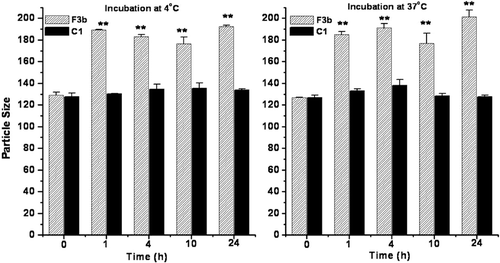
Figure 2.  Physical stability of conventional (F3b) and long circulating liposomes (C1) in fetal bovine serum as a function of particle size up to 24 h incubation. Significant values: **p < 0.01 in comparison to particle size at initial time point.

Table 3.  Pharmacokinetic parameters of PLB, free and encapsulated as conventional and pegylated liposomes, after intravenous bolus administration at a dose of 6 mg/kg to tumor bearing mice (n = 4).

Figure 3.  Plasma concentration of PLB obtained from mice after intravenous administration of free PLB, conventional (F3b) and pegylated liposomes (C1) at a dose of 6 mg/kg. The data represents mean ± SD of four animals.
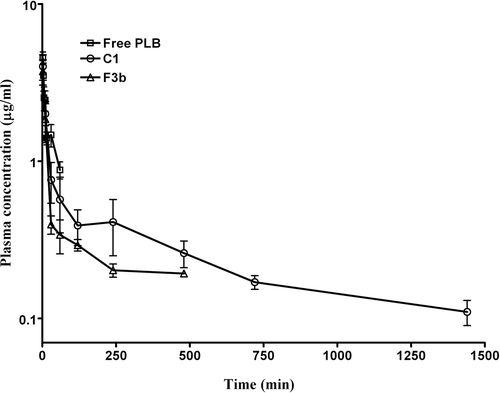
Figure 3.  Plasma concentration of PLB obtained from mice after intravenous administration of free PLB, conventional (F3b) and pegylated liposomes (C1) at a dose of 6 mg/kg. The data represents mean ± SD of four animals.

Table 4.  Tumor growth parameters for free PLB and liposomal formulations (n = 8).

Figure 4.  Effect of free PLB and formulated liposomes as conventional or pegylated (A) on tumor growth inhibition and (B) survival of C57BL/6J mice inoculated with B16F1 melanoma cells. Significant levels - ** p < 0.001 compared with vehicle treated group; a p < 0.01, b p < 0.001 compared to free plumbagin treated group. When tumor volume became about 100 ± 10 mm3, free PLB, conventional liposomes (F3b) or pegylated liposomes was intravenously injected (containing 2 mg/kg PLB each time on days 1, 3, 5, 7 and 10 (total dose of 10 mg/kg)). Control animals were injected with the vehicle (PBS containing 25% PEG-200). Each data represents the mean ± SD (n = 8).
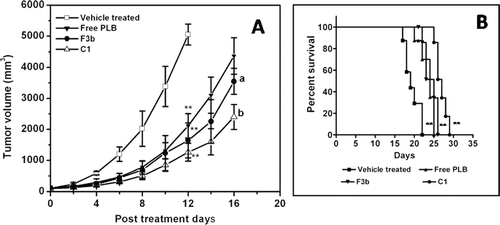
Figure 4.  Effect of free PLB and formulated liposomes as conventional or pegylated (A) on tumor growth inhibition and (B) survival of C57BL/6J mice inoculated with B16F1 melanoma cells. Significant levels - ** p < 0.001 compared with vehicle treated group; a p < 0.01, b p < 0.001 compared to free plumbagin treated group. When tumor volume became about 100 ± 10 mm3, free PLB, conventional liposomes (F3b) or pegylated liposomes was intravenously injected (containing 2 mg/kg PLB each time on days 1, 3, 5, 7 and 10 (total dose of 10 mg/kg)). Control animals were injected with the vehicle (PBS containing 25% PEG-200). Each data represents the mean ± SD (n = 8).

Table 5.  Hematological changes after intravenous administration of free PLB and pegylated liposomes (C1) for 5 consecutive days.

Figure 5.  Toxicity assessment of free PLB and long circulating liposomes (C1) in C57BL/6J mice. The histopathologic examination of tissue sections of (A) heart and kidney, (B) liver and spleen was made after mice were sacrificed and staining with H&E stain. All the treatment groups showed no signs of toxic pathological change; magnification 400X; 100X for liver.
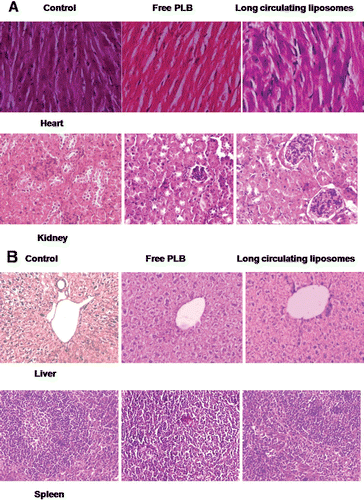
Figure 5.  Toxicity assessment of free PLB and long circulating liposomes (C1) in C57BL/6J mice. The histopathologic examination of tissue sections of (A) heart and kidney, (B) liver and spleen was made after mice were sacrificed and staining with H&E stain. All the treatment groups showed no signs of toxic pathological change; magnification 400X; 100X for liver.

Reprints and Corporate Permissions

Please note: Selecting permissions does not provide access to the full text of the article, please see our help page How do I view content?

To request a reprint or corporate permissions for this article, please click on the relevant link below:

Academic Permissions

Please note: Selecting permissions does not provide access to the full text of the article, please see our help page How do I view content?

Obtain permissions instantly via Rightslink by clicking on the button below:

If you are unable to obtain permissions via Rightslink, please complete and submit this Permissions form. For more information, please visit our Permissions help page.