1,411
Views
33
CrossRef citations to date
0
Altmetric
Research Article

Colon-targeted celecoxib-loaded Eudragit® S100-coated poly-ϵ-caprolactone microparticles: Preparation, characterization and in vivo evaluation in rats

, , &
Pages 523-535 | Received 23 Jan 2011, Accepted 27 May 2011, Published online: 28 Jul 2011

Figures & data

Table 1.  A 23 full factorial design of the prepared PCL single-coat celecoxib-loaded microparticles.

Figure 1.  DSC thermograms of celecoxib, PCL, celecoxib: PCL physical mixture and formula F2 (A) and celecoxib, PCL, Eudragit® S100, celecoxib: PCL: Eudragit® S100 physical mixture and formula F10 (B).
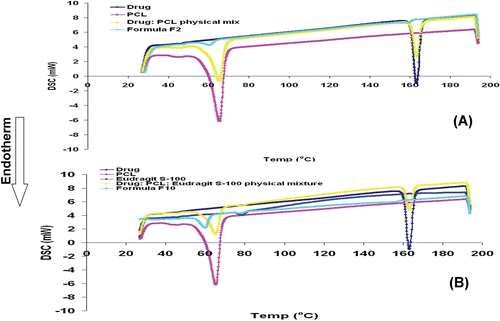
Figure 1.  DSC thermograms of celecoxib, PCL, celecoxib: PCL physical mixture and formula F2 (A) and celecoxib, PCL, Eudragit® S100, celecoxib: PCL: Eudragit® S100 physical mixture and formula F10 (B).

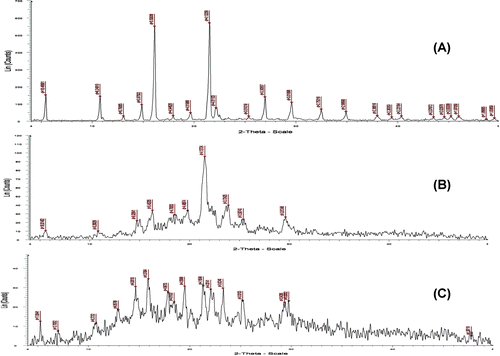
Figure 2.  X-ray diffractrograms of celecoxib (A), formula F2 (B) and formula F10 (C).

Figure 2.  X-ray diffractrograms of celecoxib (A), formula F2 (B) and formula F10 (C).

Figure 3.  A. Optical micrographs of PCL single-coat microparticles, formula F2 (A), and double-coat microparticles, formula F10 (B). B. SEM micrographs of PCL single-coat microparticles, formula F2 (C), and double-coat microparticles, formula F10 (D). Scale bar represents 300 μm, X160.
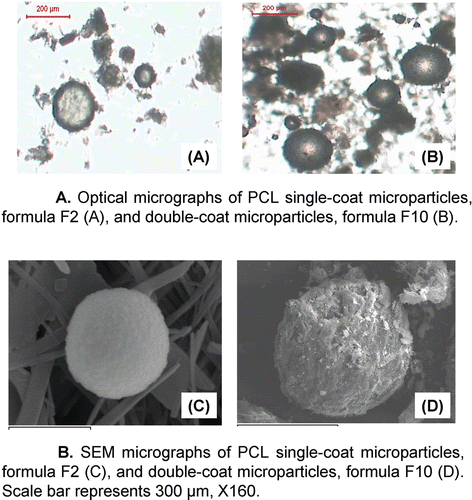
Figure 3.  A. Optical micrographs of PCL single-coat microparticles, formula F2 (A), and double-coat microparticles, formula F10 (B). B. SEM micrographs of PCL single-coat microparticles, formula F2 (C), and double-coat microparticles, formula F10 (D). Scale bar represents 300 μm, X160.

Table 2.  The particle size and the entrapment efficiency % of the prepared celecoxib-loaded microparticles, mean ± S.D., n = 3.

Figure 4.  Interaction bar plot representing the effect of PCL M.wt. (low and high), drug: PCL ratio (1:0.5 and 1: 1) and span® 80 concentration (1% and 3%, w/v) on the entrapment efficiency %, mean ± S.D.
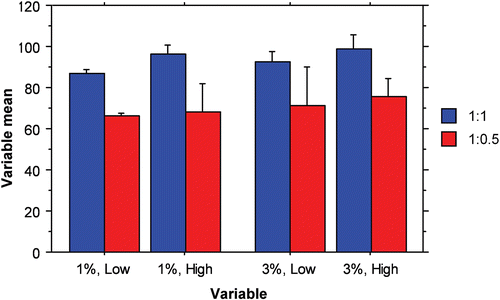
Figure 4.  Interaction bar plot representing the effect of PCL M.wt. (low and high), drug: PCL ratio (1:0.5 and 1: 1) and span® 80 concentration (1% and 3%, w/v) on the entrapment efficiency %, mean ± S.D.

Figure 5.  The influence of PCL M.wt. and drug: PCL ratio on in vitro drug release from PCL single-coat microparticles prepared using Span® 80 (1%, w/v) at 37 ± 0.5 °C (mean ± S.D., n = 3).
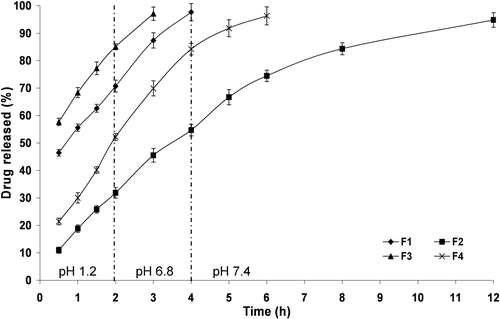
Figure 5.  The influence of PCL M.wt. and drug: PCL ratio on in vitro drug release from PCL single-coat microparticles prepared using Span® 80 (1%, w/v) at 37 ± 0.5 °C (mean ± S.D., n = 3).

Figure 6.  The influence of PCL M.wt. and drug: PCL ratio on in vitro drug release from PCL single-coat microparticles prepared using Span® 80 (3%, w/v) at 37 ± 0.5 °C (mean ± S.D., n = 3).
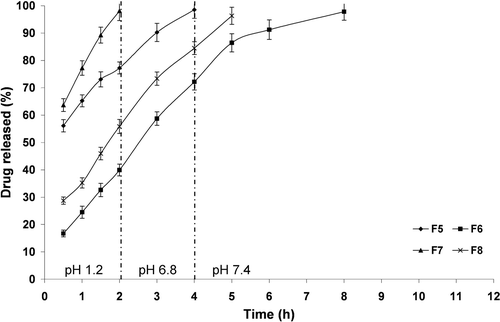
Figure 6.  The influence of PCL M.wt. and drug: PCL ratio on in vitro drug release from PCL single-coat microparticles prepared using Span® 80 (3%, w/v) at 37 ± 0.5 °C (mean ± S.D., n = 3).

Table 3.  Mathematical modeling and release kinetics of celecoxib from the investigated microparticles.

Figure 7.  Interaction bar plots representing the effect of PCL M.wt. (low and high), drug: PCL ratio (1:0.5 and 1: 1) and Span® 80 concentration (1% and 3%, w/v) on Q2h (A) and Q4h (B), mean ± S.D.
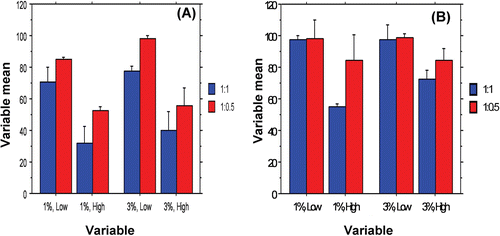
Figure 7.  Interaction bar plots representing the effect of PCL M.wt. (low and high), drug: PCL ratio (1:0.5 and 1: 1) and Span® 80 concentration (1% and 3%, w/v) on Q2h (A) and Q4h (B), mean ± S.D.

Figure 8.  In vitro drug release from PCL single-coat microparticles (F2), Eudragit® S100 single-coat microparticles (F9) and double-coat microparticles (F10) at 37 ± 0.5 °C (mean ± S.D., n = 3).
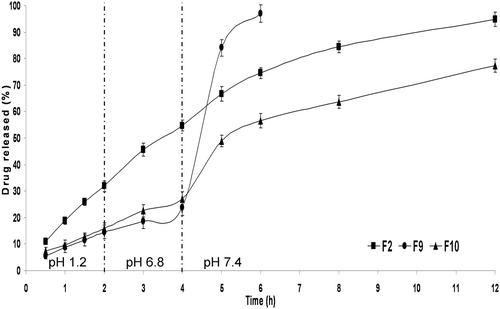
Figure 8.  In vitro drug release from PCL single-coat microparticles (F2), Eudragit® S100 single-coat microparticles (F9) and double-coat microparticles (F10) at 37 ± 0.5 °C (mean ± S.D., n = 3).

Table 4.  Pharmacokinetic parameters of celecoxib following oral administration of aqueous suspensions of the best achieved microparticles (Formula F10) and celecoxib powder to rats (mean ± SD, n = 6).

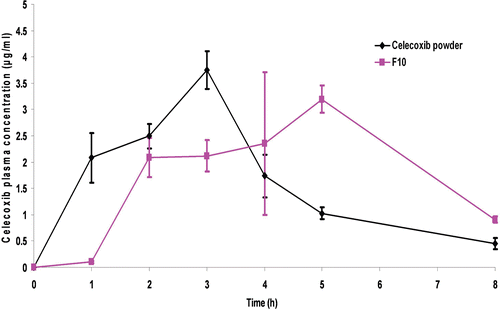
Figure 9.  Plasma concentration–time profiles of celecoxib following oral administration of aqueous suspensions of the best achieved microparticles (F10) and celecoxib powder to fasted rats (mean ± SD, n = 6).

Figure 9.  Plasma concentration–time profiles of celecoxib following oral administration of aqueous suspensions of the best achieved microparticles (F10) and celecoxib powder to fasted rats (mean ± SD, n = 6).

Reprints and Corporate Permissions

Please note: Selecting permissions does not provide access to the full text of the article, please see our help page How do I view content?

To request a reprint or corporate permissions for this article, please click on the relevant link below:

Academic Permissions

Please note: Selecting permissions does not provide access to the full text of the article, please see our help page How do I view content?

Obtain permissions instantly via Rightslink by clicking on the button below:

If you are unable to obtain permissions via Rightslink, please complete and submit this Permissions form. For more information, please visit our Permissions help page.