1,979
Views
49
CrossRef citations to date
0
Altmetric
Research Article

Enhanced targeting efficiency of PLGA microspheres loaded with Lornoxicam for intra-articular administration

, , &
Pages 536-544 | Received 27 Feb 2011, Accepted 09 Jun 2011, Published online: 04 Aug 2011

Figures & data

Figure 1.  Size distribution of Lnxc-PLGA-MS. A: undried microspheres; B: freeze dried microspheres; C: vacuum dried microspheres
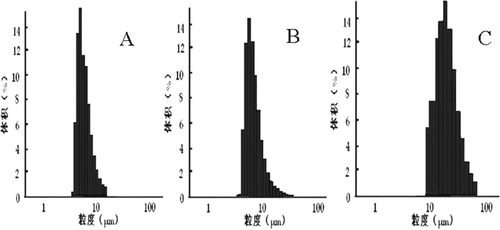
Figure 1.  Size distribution of Lnxc-PLGA-MS. A: undried microspheres; B: freeze dried microspheres; C: vacuum dried microspheres

Figure 2.  SEM microphotos of Lnxc-PLGA-MS A,B: freeze-dried microspheres; C, D vacuum-dried microspheres
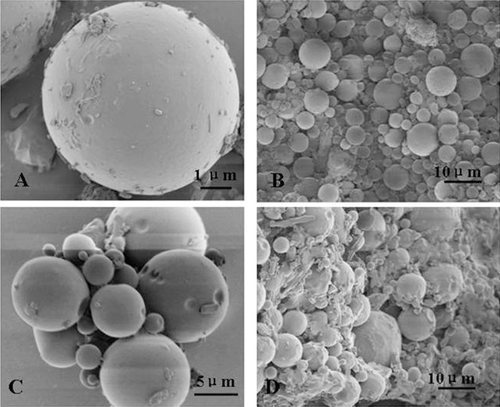
Figure 2.  SEM microphotos of Lnxc-PLGA-MS A,B: freeze-dried microspheres; C, D vacuum-dried microspheres

Figure 3.  The DSC results of Lnxc loaded PLGA microspheres (A) Lnxc loaded microspheres(freeze drying without mannitol), (B) Lnxc loaded microspheres (freeze drying with mannitol), (C) physical mixture(with mannitol), (D) physical mixture(without mannitol), (E) mannitol, (F) PLGA, (G) gelatin, (H) Lnxc.
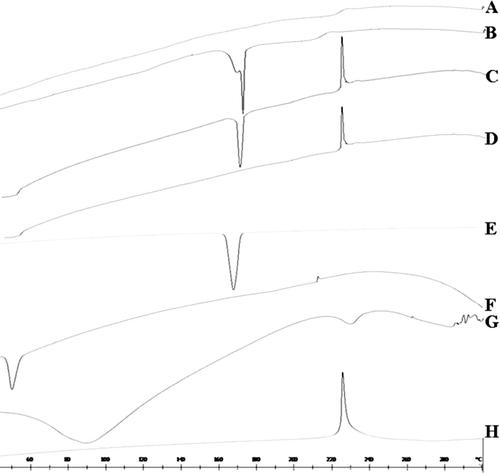
Figure 3.  The DSC results of Lnxc loaded PLGA microspheres (A) Lnxc loaded microspheres(freeze drying without mannitol), (B) Lnxc loaded microspheres (freeze drying with mannitol), (C) physical mixture(with mannitol), (D) physical mixture(without mannitol), (E) mannitol, (F) PLGA, (G) gelatin, (H) Lnxc.

Figure 4.  in.vitro release of Lnxc-PLGA-MS (mean ± SD, n = 3)

Figure 4.  in.vitro release of Lnxc-PLGA-MS (mean ± SD, n = 3)

Table 1.  The regression equation of in vitro release of Lnxc and Lnxc-PLGA-MS

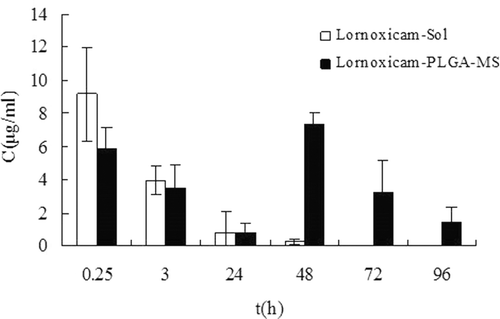
Figure 5.  Mean plasma concentration of Lnxc after intra-articular injection of Lnxc-Soland Lnxc-PLGA-MS in rabbits (n = 5).
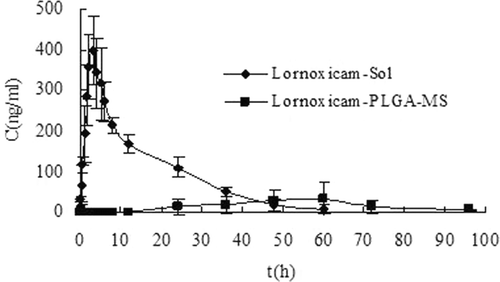
Figure 5.  Mean plasma concentration of Lnxc after intra-articular injection of Lnxc-Soland Lnxc-PLGA-MS in rabbits (n = 5).

Table 2.  The pharmacokinetic parameters of Lnxc after intra-articular injection of Lnxc-Sol and Lnxc-PLGA-MS in rabbits (n = 5)
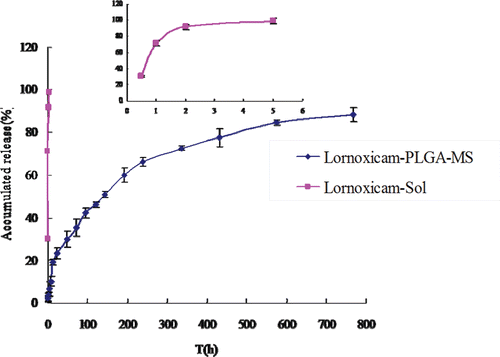
Figure 6.  The distribution of Lnxc in synovial fluid of rats at different time points after intra-articular injection of Lnxc-Sol and Lnxc-PLGA-MS (n = 5).

Figure 6.  The distribution of Lnxc in synovial fluid of rats at different time points after intra-articular injection of Lnxc-Sol and Lnxc-PLGA-MS (n = 5).

Reprints and Corporate Permissions

Please note: Selecting permissions does not provide access to the full text of the article, please see our help page How do I view content?

To request a reprint or corporate permissions for this article, please click on the relevant link below:

Academic Permissions

Please note: Selecting permissions does not provide access to the full text of the article, please see our help page How do I view content?

Obtain permissions instantly via Rightslink by clicking on the button below:

If you are unable to obtain permissions via Rightslink, please complete and submit this Permissions form. For more information, please visit our Permissions help page.