3,391
Views
75
CrossRef citations to date
0
Altmetric
Original Article

Development of optimized self-nano-emulsifying drug delivery systems (SNEDDS) of carvedilol with enhanced bioavailability potential

, , , &
Pages 599-612 | Received 07 Jan 2011, Accepted 23 Jun 2011, Published online: 18 Oct 2011

Figures & data

Table 1.  Preparation of SNEDDS as per the experimental design.

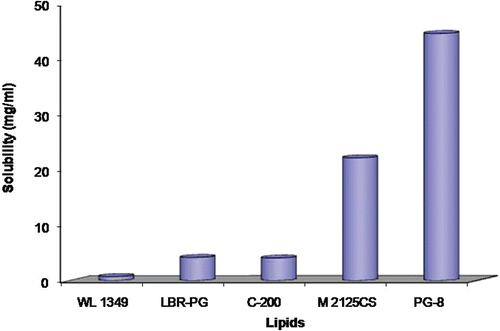
Figure 1.  Solubility of carvedilol in various commercially available oil and lipidic excipients.

Figure 1.  Solubility of carvedilol in various commercially available oil and lipidic excipients.

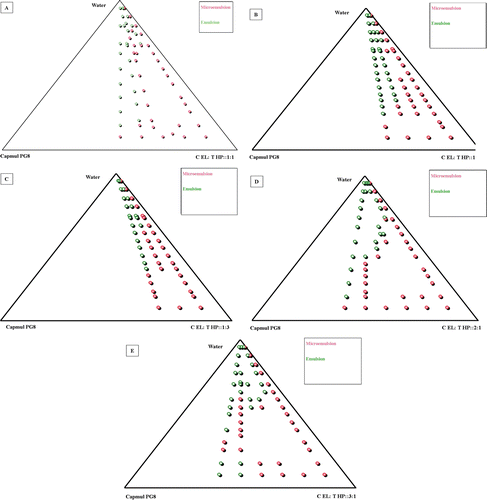
Figure 2.  (a–e) Pseudo-ternary phase diagrams.

Figure 2.  (a–e) Pseudo-ternary phase diagrams.

Figure 3.  Plot between mean percent carvedilol release for all 13 formulations prepared as per 2-factor central composite design where SCD 5 represents the mean of five formulations. The insert shows the release behavior of formulations in 20 min and mean rate of release vs midpoint of time interval.
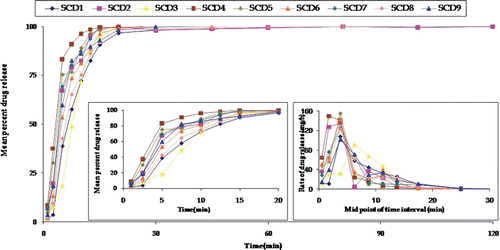
Figure 3.  Plot between mean percent carvedilol release for all 13 formulations prepared as per 2-factor central composite design where SCD 5 represents the mean of five formulations. The insert shows the release behavior of formulations in 20 min and mean rate of release vs midpoint of time interval.

Figure 4.  Response surface plot and the corresponding contour plot showing the influence of Cremophor and Transcutol on Q5min for self-emulsifying formulations of carvedilol.
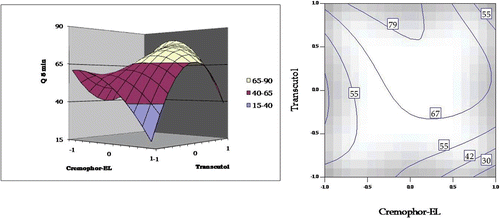
Figure 4.  Response surface plot and the corresponding contour plot showing the influence of Cremophor and Transcutol on Q5min for self-emulsifying formulations of carvedilol.

Figure 5.  Response surface plot and the corresponding contour plot showing the influence of Cremophor and Transcutol on mean dissolution time (MDT) values for self-emulsifying formulations of carvedilol.
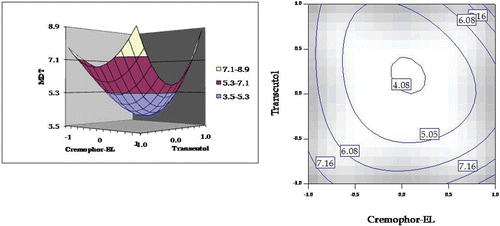
Figure 5.  Response surface plot and the corresponding contour plot showing the influence of Cremophor and Transcutol on mean dissolution time (MDT) values for self-emulsifying formulations of carvedilol.

Figure 6.  Response surface plot and the corresponding contour plot showing the influence of Cremophor and Transcutol on emulsion droplet size (surface length diameter) for self-emulsifying formulations of carvedilol.
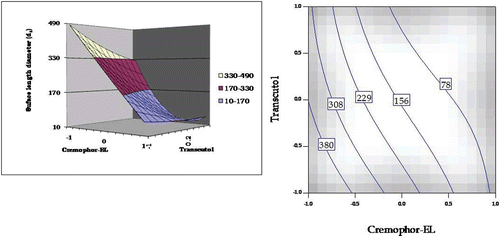
Figure 6.  Response surface plot and the corresponding contour plot showing the influence of Cremophor and Transcutol on emulsion droplet size (surface length diameter) for self-emulsifying formulations of carvedilol.

Figure 7.  Response surface plot and the corresponding contour plot showing the influence of Cremophor and Transcutol on emulsification time for self-emulsifying formulations of carvedilol.
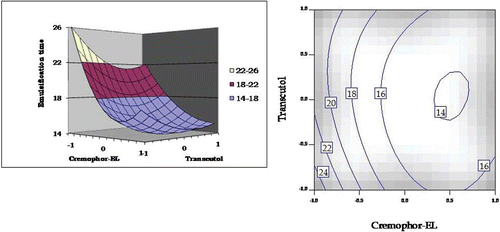
Figure 7.  Response surface plot and the corresponding contour plot showing the influence of Cremophor and Transcutol on emulsification time for self-emulsifying formulations of carvedilol.

Figure 8.  Linear plot and residual plot between the observed and predicted values of (a) Q5min, (b) MDT, (c) droplet size, and (d) emulsification time.
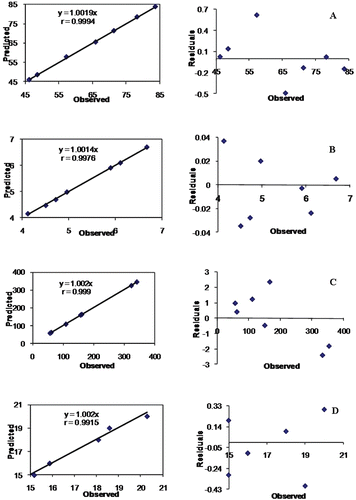
Figure 8.  Linear plot and residual plot between the observed and predicted values of (a) Q5min, (b) MDT, (c) droplet size, and (d) emulsification time.

Figure 9.  Plot showing mean percent carvedilol release of pure drug, marketed formulation, and two optimized formulations. The insert shows the mean rate of release vs midpoint of time interval.
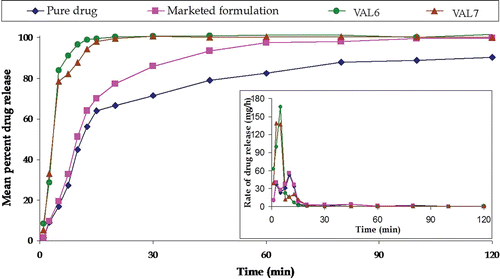
Figure 9.  Plot showing mean percent carvedilol release of pure drug, marketed formulation, and two optimized formulations. The insert shows the mean rate of release vs midpoint of time interval.

Figure 10.  Plot depicting percent increase in permeability parameters (intrinsic permeability, effective permeability, and wall permeability) in marketed formulation and optimized formulations, VAL6 and VAL7, vis-à-vis pure drug using an ex-vivo SPIP technique.
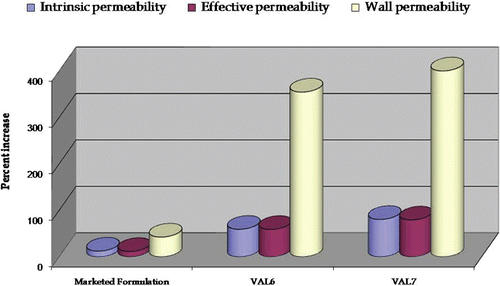
Figure 10.  Plot depicting percent increase in permeability parameters (intrinsic permeability, effective permeability, and wall permeability) in marketed formulation and optimized formulations, VAL6 and VAL7, vis-à-vis pure drug using an ex-vivo SPIP technique.
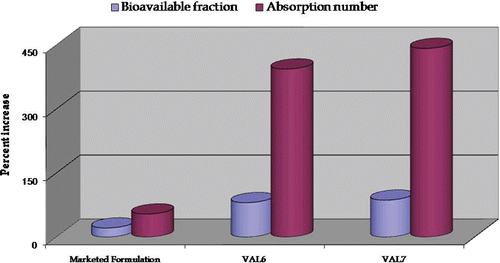
Figure 11.  Plot depicting percent increase in absorption parameters (bioavailable fraction and absorption number) in marketed formulation and optimized formulations, VAL6 and VAL7, vis-à-vis pure drug using an ex-vivo SPIP technique.

Figure 11.  Plot depicting percent increase in absorption parameters (bioavailable fraction and absorption number) in marketed formulation and optimized formulations, VAL6 and VAL7, vis-à-vis pure drug using an ex-vivo SPIP technique.

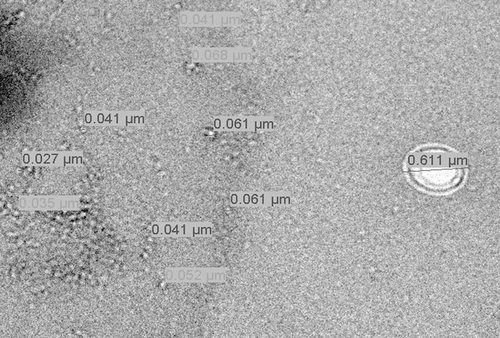
Figure 12.  TEM images showing particle size of optimized formulation VAL7.

Figure 12.  TEM images showing particle size of optimized formulation VAL7.

Table 2.  Effect on the parameters during the accelerated stability studies kept at 25°C ± 2°C/60% RH ± 5% RH and 40°C ± 2°C/75% RH ± 5%.
Reprints and Corporate Permissions

Please note: Selecting permissions does not provide access to the full text of the article, please see our help page How do I view content?

To request a reprint or corporate permissions for this article, please click on the relevant link below:

Academic Permissions

Please note: Selecting permissions does not provide access to the full text of the article, please see our help page How do I view content?

Obtain permissions instantly via Rightslink by clicking on the button below:

If you are unable to obtain permissions via Rightslink, please complete and submit this Permissions form. For more information, please visit our Permissions help page.