Figures & data
Table 1. Formula for different batches of ondansetron hydrochloride-loaded CPG microspheres.
Table 2. Characteristics of prepared ondansetron hydrochloride-loaded microspheres.
Figure 1. Scanning electron micrograph of ondansetron hydrochloride-loaded microspheres.
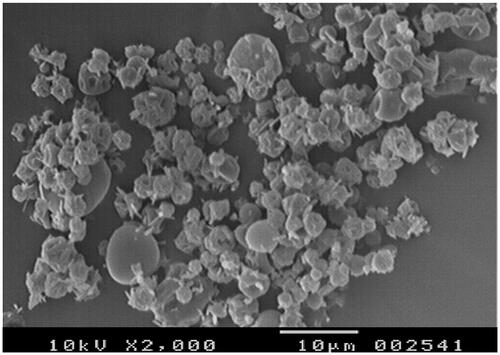
Figure 2. Particle size analysis of ondansetron hydrochloride-loaded microspheres.
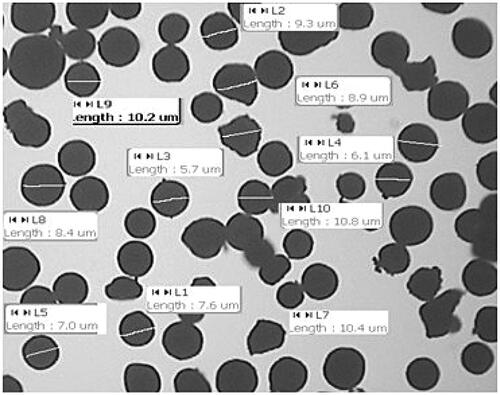
Figure 3. Zeta potential distribution curve of ondansetron-loaded CPG microspheres.
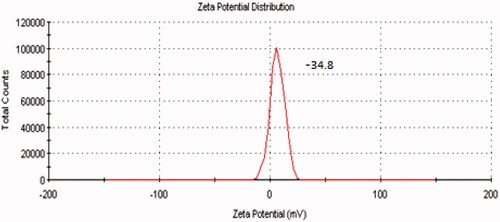
Figure 4. DSC spectra of ondansetron hydrochloride (OND), CPG and ondansetron hydrochloride-loaded microspheres (OCP).
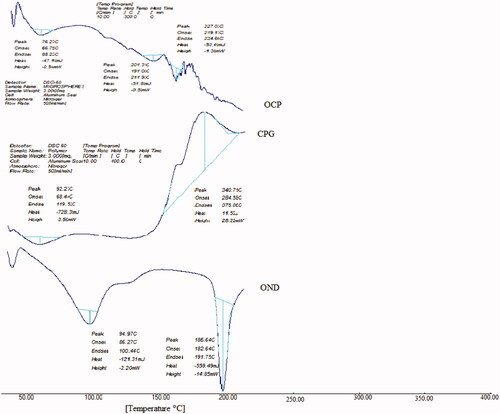
Figure 5. X-ray diffractogram of ondansetron hydrochloride (OND), CPG and ondansetron hydrochloride-loaded microspheres (OCP).
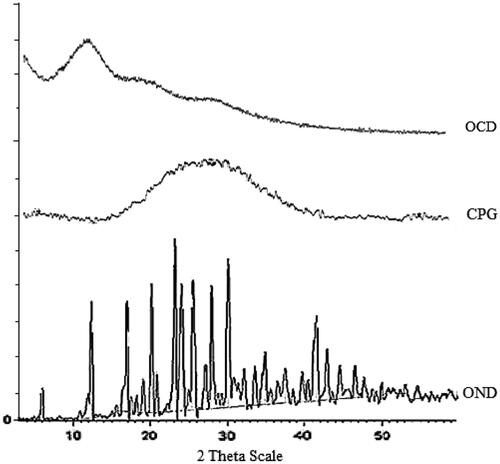
Figure 6. In-vitro drug release of ondansetron hydrochloride from microspheres.
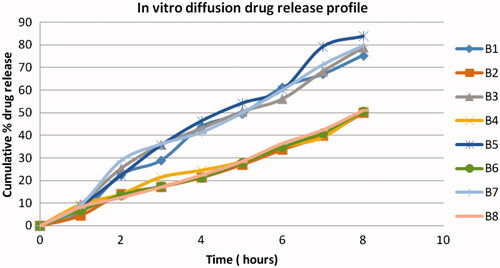
Table 3. In-vitro release kinetic parameter of ondansetron hydrochloride-loaded CPG from microspheres.
Figure 7. Light photomicrograph of nasal mucosa, untreated mucosa (A) and microspheres treated mucosa (B).
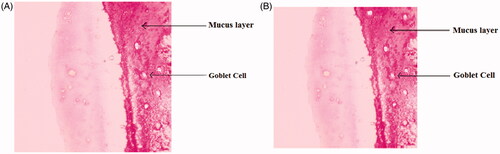
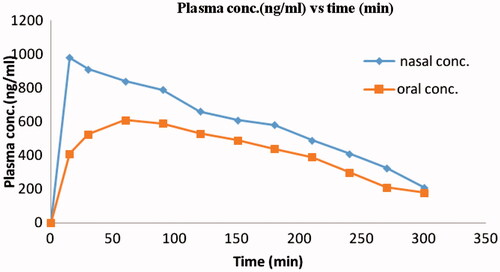
Figure 8. Comparative profile of nasal and oral drug concentrations in plasma versus time.