Figures & data
Figure 1. ESEM photographs of O + F/fiber.
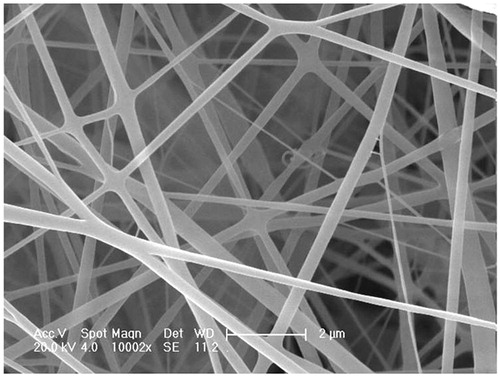
Figure 2. Release profiles of oxaliplatin and 5-Flu from the O + F/fiber after incubation in buffer solutions of pH5.0. Each data point represents the average of triplicate samples and error bars represent standard deviation (n = 3).
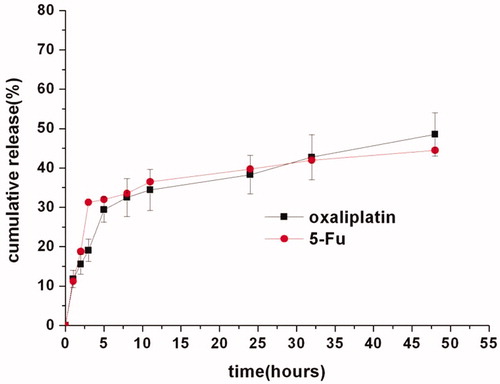
Figure 3. Cytotoxicity of the O + F/fiber mats to human colorectal HCT-8 cells. The final mixed drug concentration of oxaliplatin and 5-Flu (at the mass ratio of 1:5) in free drug group was 0.1 mg ml−1 (A), 0.05 mg ml−1 (B) and 0.025 mg ml−1 (C), respectively. The drug content of oxaliplatin and 5-Flu in O + F/fiber is equivalent to the total drug content used in the free drug group. Each data point represents the average of triplicate samples and error bars represent standard deviation (n = 3).
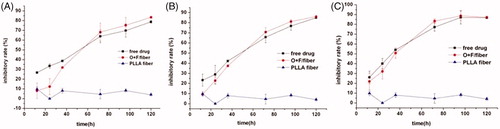
Figure 4. Cell cycle analysis of HCT-8 cells at 24, 48, 72 and 96 h after treatment with PLLA fiber, free drug, O + F/fiber and nothing as control.
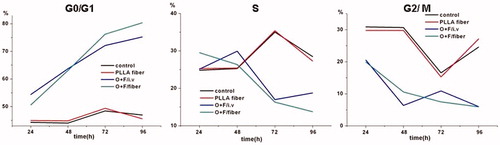
Figure 5. The curve of tumor volume plotted to growth time in CT26 tumor-bearing mice after treatment with O + F/fiber, O + F/i.v, PLLA fiber, and nothing as control. The relative volumes were obtained by dividing actual cancer volumes by that on Day 0. The results mentioned above are given as mean value ± SD, over eight mice in a group.
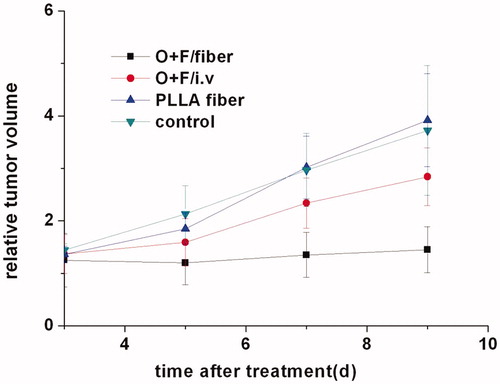
Figure 6. Histopathological observation of local tissue samples retrieved on day 10 after treatment with O + F/i.v (A), O + F/fiber (B), PLLA fiber (C), and nothing as control (D). Bars represent 500 μm. N = necrosis; T = viable tumor tissue.
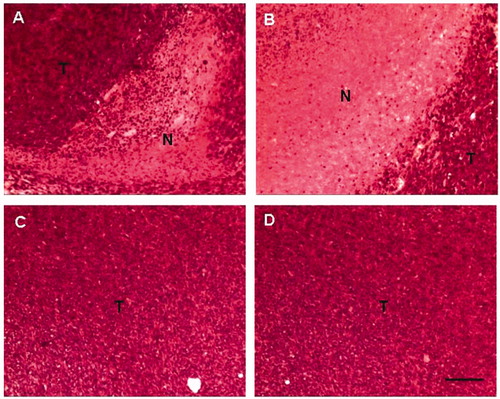
Figure 7. Immunohistochemical staining of Bax and Bcl-2 in tumors retrieved on day 10 after treatment with O + F/i.v (A), O + F/fiber (B), PLLA fiber (C), and nothing as control (D). Bars represent 50 μm.
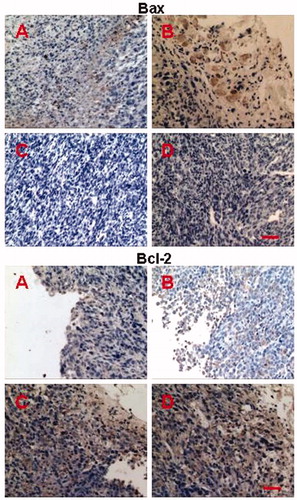
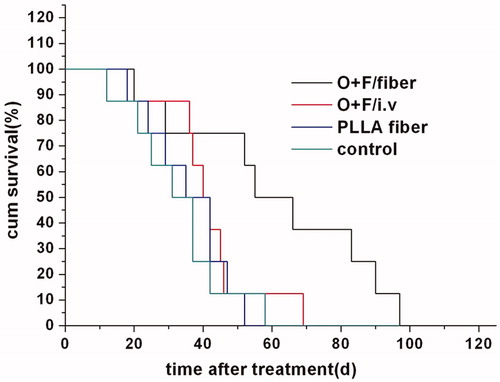
Figure 8. Survival curve of CT26 tumor-bearing mice after treatment with O + F/i.v (A), O + F/fiber (B), PLLA fiber (C), and nothing as control (D).