Figures & data
Figure 1. In vitro drug release profiles of liposomes in PBS (pH 7.4) (A) and in the presence of resting and activated platelets (B).
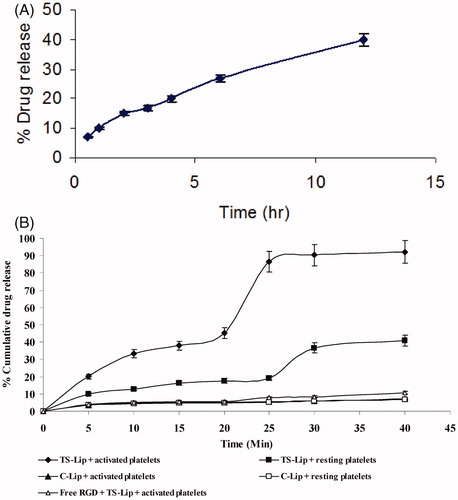
Figure 2. Confocal microscopic images of platelets incubated with TS liposomes (A1,B1,C1) and control liposomes (A2,B2,C2). A1 and A2 represent platelets incubated with rhodamine; B1 and B2 represent platelets incubated with FITC-labeled formulations and C1 and C2 are superimposed images of A and B.
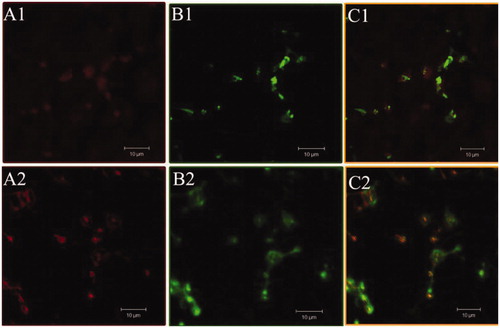
Figure 3. Flow cytometric analysis of interaction of liposomes with platelets in vitro. (1) Unlabeled platelets; (2) platelets incubated with control liposomes; and (3) platelets incubated with TS liposomes.
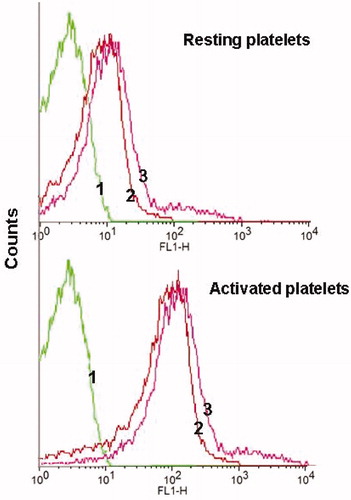
Figure 4. Intravital microscopic images of thrombus area of the mesenteric arteriole of mice following administration of FITC-labeled control liposomes (B) and FITC-labeled TS liposomes (C). (A) Represents control thrombus area in which platelets were stained with calcein-AM.
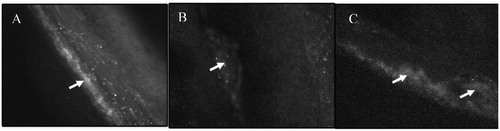
Figure 5. In vivo thrombus accumulation of SK formulations at different time intervals (data presented are mean ± SD, n = 6).
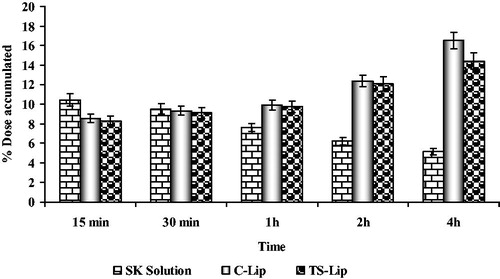
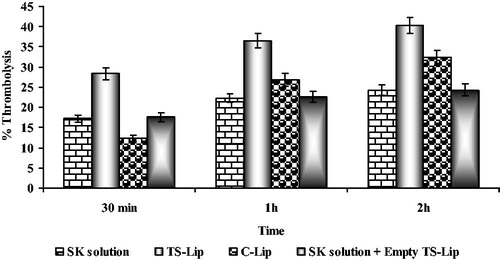
Figure 6. Thrombolytic activity of various SK formulations at different time points (data presented are mean ± SD, n = 6).