Figures & data
Table 1. Quality target product profile (QTPP) for GR hollow microballoons of ITH.
Table 2. Critical quality attributes (CQAs) for GR hollow microballoons of ITH and their justifications.
Table 3. Formulation and process variables with their respective high and low levels investigated employing Taguchi design.
Table 4. Formulation composition of GR hollow microballoons prepared as per BBD.
Figure 1. Ishikawa fish-bone diagram depicting the cause-and-effect relationship among the formulation and process variable for formulation of GR hollow microballoons of ITH.
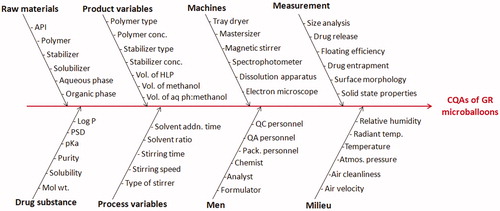
Table 5. REM for initial risk assessment of GR hollow microballoons of ITH.
Table 6. Summary of FMEA analysis illustrating RPN scores for various formulation and process variables affecting the CQAs.
Figure 2. Pareto charts for screening of influential factors as per Taguchi design using chosen critical quality attributes (CQAs), (A) percent yield, (B) entrapment efficiency, (C) floating time.
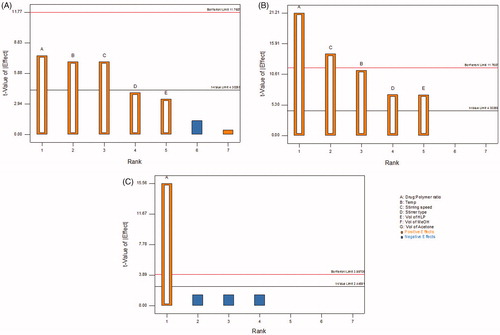
Table 7. Coefficient of model terms and statistical parameters obtained for second order quadratic equations for the studied CQAs.
Figure 3. Response surface plots showing the influence of CMAs and CPPs, i.e. amount of polymer, stirring temperature and stirring speed on CQAs, (A) EE, (B) particle size, (C) T60% and (D) Q18h of GR microballoons of ITH.
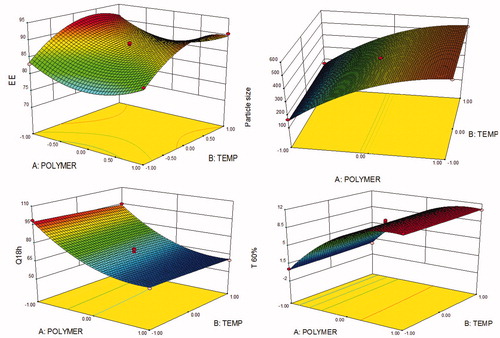
Figure 4. Linear correlation plots and residual plots between the observed and predicted values of various CQAs, (A–B) entrapment efficiency, (C–D) particle size, (E–F) T60% and (G–H) Q18h.
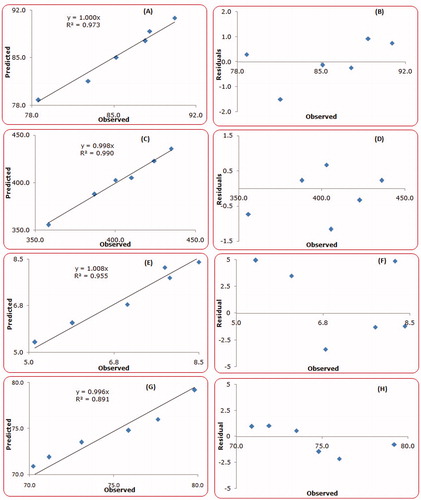
Figure 5. Dissolution profiles of optimized GR microballoon formulation of ITH and marketed tablet (Ganton). The inset depicts mean rate of drug release versus mid-point of time intervals from optimized microballoons vis-à-vis the marketed tablet.
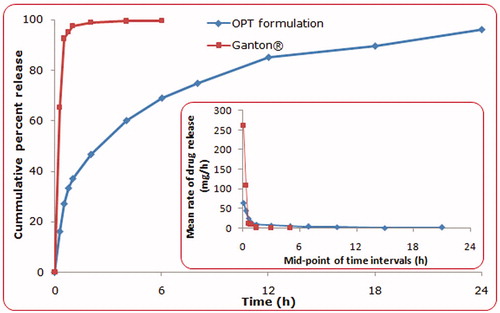
Figure 6. Scanning electron microscopy images of the optimized GR hollow microspheres.
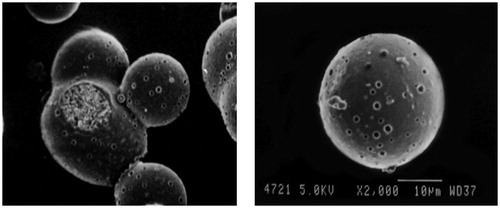
Figure 7. FTIR spectra of pure drug, Eudragit S-100, physical mixture of drug and polymer, and optimized microballoon formulation.
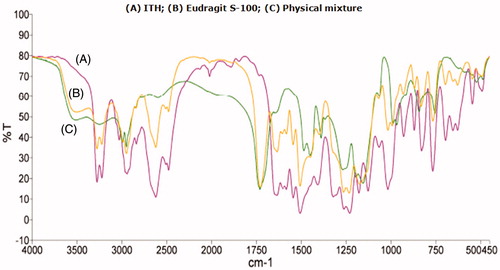
Figure 8. DSC thermograms of pure drug, Eudragit S-100, physical mixture of drug and polymer, and optimized GR microballoons.
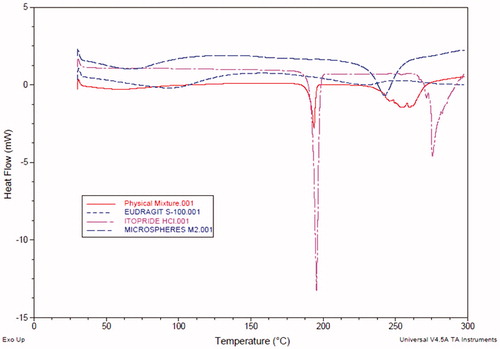
Figure 9. PXRD patterns of pure drug, Eudragit S-100, physical mixture of drug and polymer, and optimized GR microballoons.
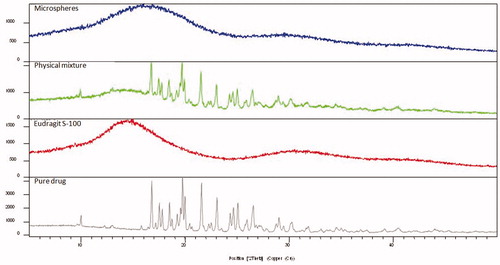
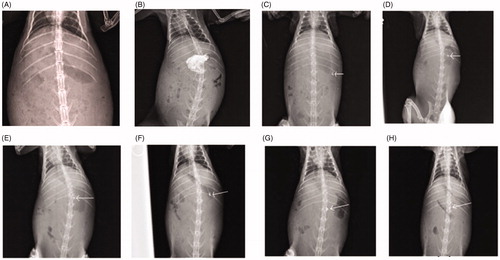
Figure 10. X-ray images of the rabbit stomach, (A) without microballoons, (B) with barium meal, (C) after 30 min administration of microballoons, (D) after 2 h administration of microballoons, (E) after at 3 h administration of microballoons, (F) after 4 h administration of microballoons, (G) after 6 h administration of microballoons, (H) after at 8 h administration of microballoons.