Figures & data
Table 1. Studies schedule in rats for different formulations.
Figure 1. Release profiles of EMZ pellets coated with different curing time at the blend ratios ERS/ERL of 5:5 and the same coating weight of 5% (n = 3).
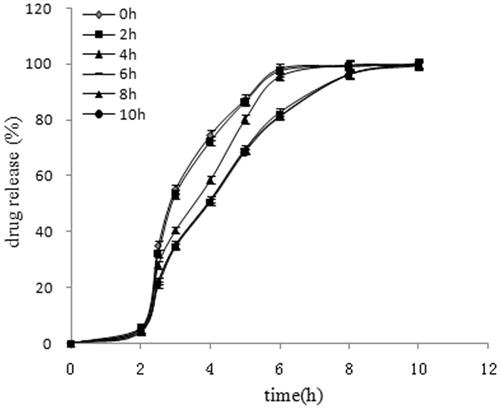
Figure 2. Release profiles of EMZ pellets coated with different blend ratios of ERS/ERL at the same coating weight of 5% (n = 3).
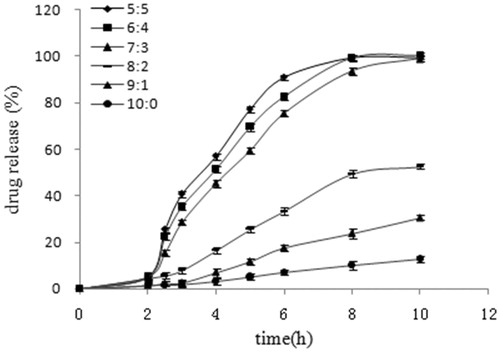
Figure 3. Effects of the coating weight on drug release from pellets coated with ERS/ERL of 7/3 (n = 3).
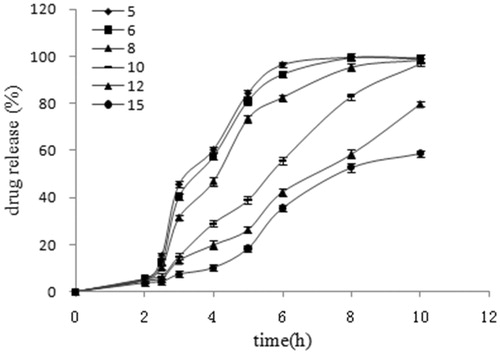
Figure 4. The release profiles of EMZ-MRPs with fixed film curing time of 6 h, ERS/ERL ratio of 7/3 and coating weight of 10% in different pH medium. Each point represents the mean ± SD (n = 3).
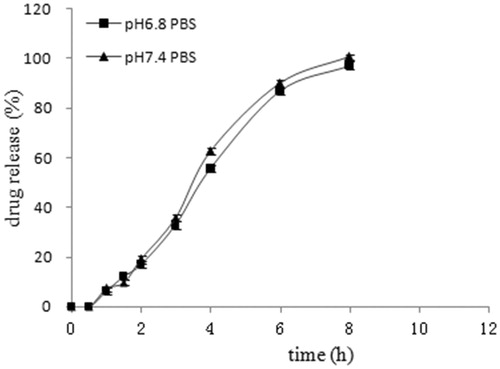
Figure 5. In vitro release profiles of EMZ-MRPs and EMZ-ECPs. Each point represents the mean ± SD (n = 3).
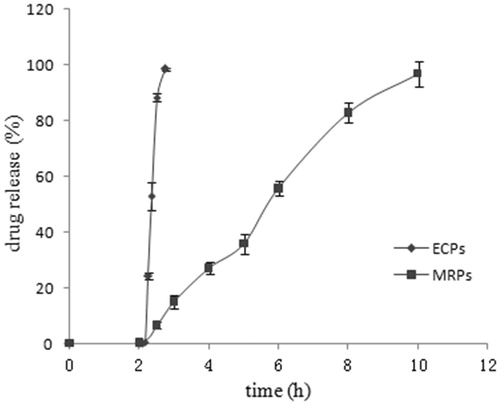
Table 2. Mathematical modeling and drug release kinetics from EMZ-MRPs.
Figure 6. SEM photographs of EMZ-MRPs. (A: × 50, B: × 90 and C: × 400) (0: sugar starter cores; 1: drug layer; 2: isolated layer; 3: sustained release polymer layer; 4: isolated layer; 5: enteric polymer layer).
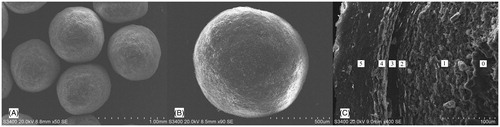
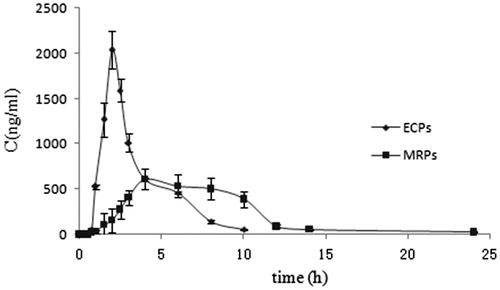
Figure 7. EMZ plasma concentration curves. Each point represents the mean ± SD (n = 6).