Figures & data
Table 1. Size and zeta potential of the nanoparticles (n = 6).
Figure 1. Determination of APT on the surface of nanoparticles by flow cytometry. (A) Cy3–NC-miRNA/ATE; (B) NC-miRNA/ATE–APT–FAM; (C) NC-miRNA/ATE–APT; and (D) Cy3–NC-miRNA/ATE–APT–FAM.
APT, aptamer and ATE, atelocollagen.
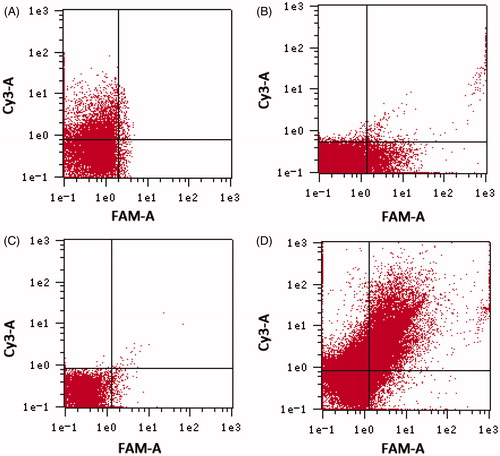
Figure 2. ATE–APT blocks degradation of siRNA from nuclease, naked NC-miRNA, miRNA/Lipofectamine 2000 complex and NC-miRNA/ATE–APT complex were incubated in the presence of RNase (0.1 mg/ml) for 0, 5, 15, 30, 45 and 60 min at 37 °C and then agarose gel electrophoresed. The presence of miRNA was revealed by ethidium bromide staining. APT, aptamer; ATE, atelocollagen; and NC, negative control.
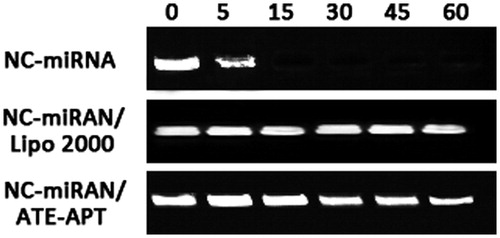
Figure 3. (A) Luciferase activity analysis (n = 4, error bars represent the standard deviation) and (B–D) fluorescence microscopy images (scale bar 50 µm) after transfection of pGL-3/ATE (B), pEGFP/ATE–APT (C) or pEGFP/Lipo 2000 (D) against PC3 and LNCaP cells, respectively. *p < 0.05. APT, aptamer; ATE, atelocollagen; NC, negative control; NPs, nanoparticles; and Lipo 2000, Lipofectamine 2000.
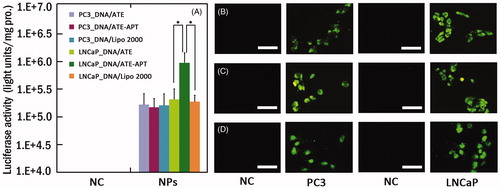
Figure 4. Bcl-2, Cyclin D1 and Wnt3a knocks down following miRNA/ATE–APT complexes delivery to LNCaP cells. Cells were treated with miRNA/ATE–APT (miRNA) and NC-miRNA/ATE–APT (NC-miRNA) complexes and processed for immunoblotting with anti-Bcl-2, anti-Cyclin D1 and anti-Wnt3a antibodies at 24, 48 and 72 h post-transfection. β-actin was a loading control. APT, aptamer; ATE, atelocollagen; and NC, negative control.
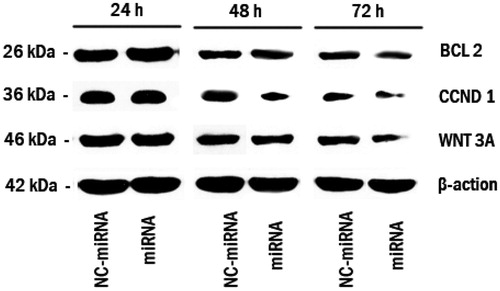
Figure 5. Viability of LNCaP cells treated with miRNA/ATE–APT, NC-miRNA/ATE–APT and miRNA/ATE complexes (n = 3, error bars represent the standard deviation). APT, aptamer; ATE, atelocollagen; and NC, negative control.
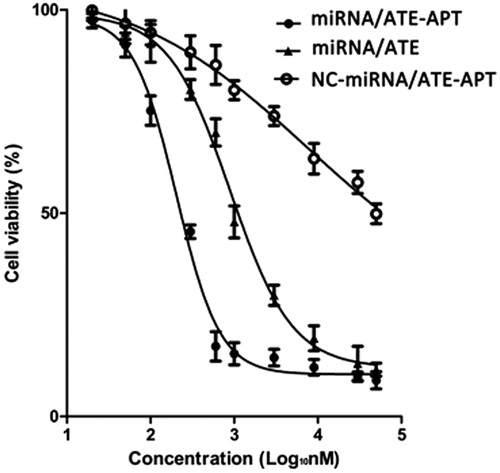
Figure 6. Kaplan–Meier survival curve of human PCa bone metastasis mice model. APT, aptamer; ATE, atelocollagen; and NC, negative control.
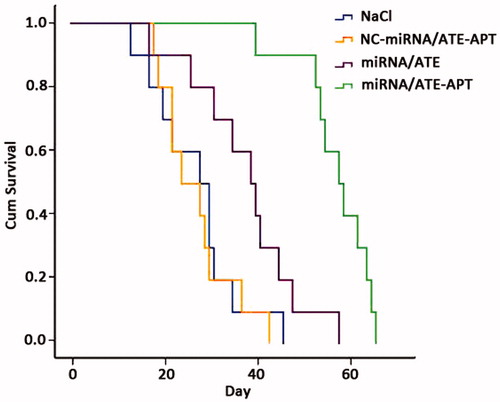
Table 2. In vivo effects of nanoparticles on human PCa bone metastasis mice model.
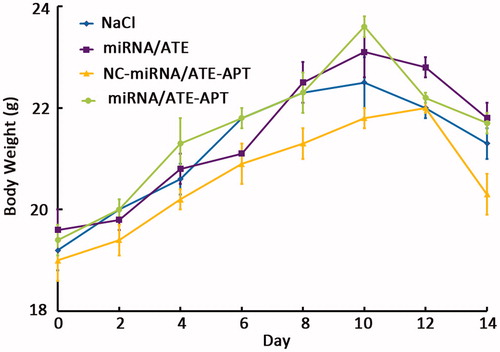
Figure 7. Change in body weight of animals as a function of time in human PCa bone metastasis mice model (n = 10). APT, aptamer; ATE, atelocollagen; and NC, negative control.