Figures & data
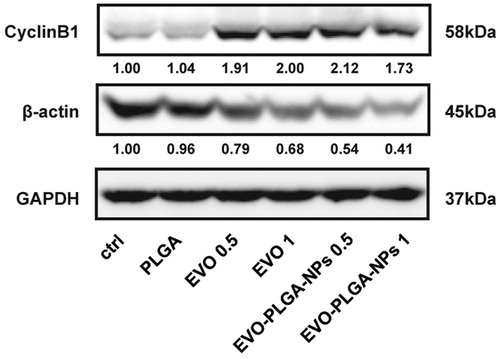
Figure 1. Chemical structure of EVO.
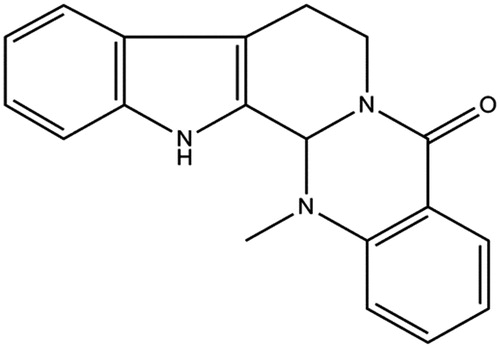
Figure 2. (A) Solubility of EVO (physical mixture EVO and EVO-PLGA NPs) in PBS (pH = 7.4); EVO (5 mg) was insoluble in PBS (pH 7.4), while EVO-PLGA NPs were fully soluble in aqueous solution; (B) TEM images of EVO-PLGA NPs; (C) and (D) particle size distribution and zeta potential of EVO-PLGA NPs.
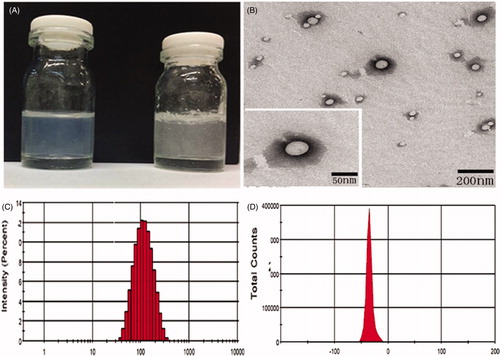
Table 1. Influence of copolymer composition on nanoparticle properties.
Table 2. Characteristic of EVO-PLGA NPs.
Figure 3. The DSC curves of physical mixture EVO, PLGA, and EVO-PLGA NPs.
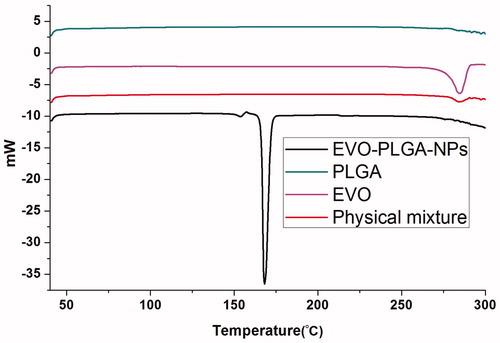
Figure 4. In vitro cumulative percent release of EVO-loaded PLGA nanoparticles and EVO physical mixture in phosphate buffer at 37 °C.
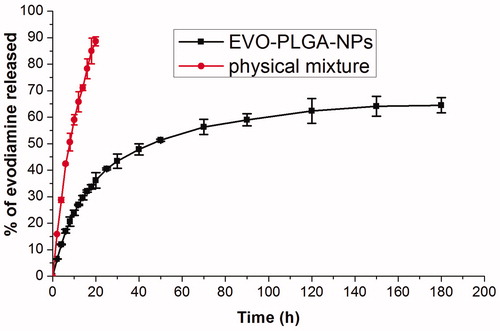
Figure 5. Cell proliferation was assessed after treating cells with EVO and EVO-loaded PLGA nanoparticles in MCF-7 cells by MTT assay. Cell viability was expressed as a percentage of the control (untreated cells). All assays were performed in six replicates and repeated at least three times (n ≥ 3).
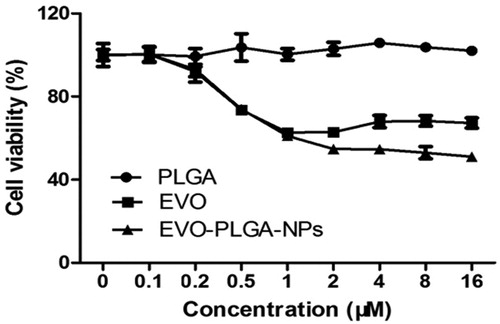
Figure 6. Morphologic changes of MCF-7 cells. (A) ctrl, (B) 0.5 μM EVO, (C) 1 μM EVO, (D) PLGA (the equivalent amount of PLGA in 1 μM EVO-PLGA NPs), (E) 0.5 μM EVO-PLGA NPs, (F) 1 μM EVO-PLGA NPs. Microscope observation showed that EVO and EVO-PLGA NPs treatment induced morphologic changes in MCF-7 cells.
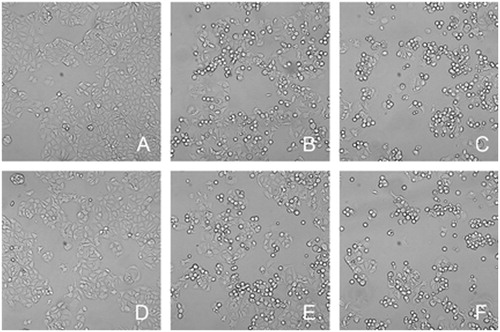
Figure 7. Colony formation assay indicated that treatment of EVO and EVO-PLGA NPs made a significant effect for the proliferation of MCF-7 cells.
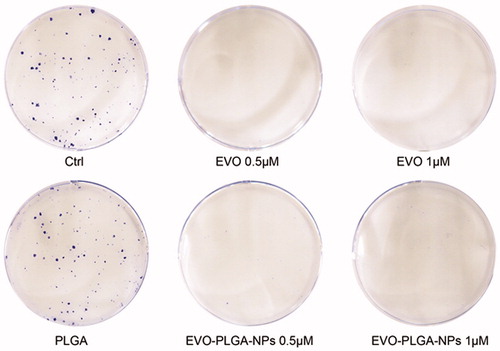
Figure 8. Cell cycle analysis. Cells were treated for 24 h with different concentrations of EVO or EVO-PLGA NPs. Cells were fixed with ethanol, stained with PI (50 μg/mL) and analyzed by flow cytometry (Becton Dickinson FACS Canto™, Franklin Lakes, NJ). At least 10 000 events were counted for each sample. The percentages of cell distribution in G0/G1, G2/M, and S-phases were analyzed by Modfit 3.0 software (Topsham, ME). Relative distribution of cell population in the cell cycle phases is presented. (A) ctrl, (B) 0.5 μM EVO, (C) 1 μM EVO, (D) PLGA (the equivalent amount of PLGA in 1 μM EVO-PLGA NPs), (E) 0.5 μM EVO-PLGA NPs, the equivalent amount of 0.5 μM EVO, and (F) 1 μM EVO-PLGA NPs, the equivalent amount of 1 μM EVO.
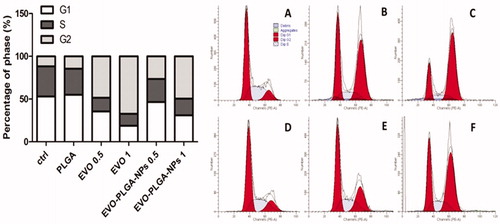
Figure 9. Western blotting analysis. The proteins of cell extracts from treated and untreated cells were prepared as previous mentioned, and fractionated by SDS–PAGE. Primary antibodies including cyclin B1 and β-actin were used. Rabbit monoclonal antibody against GAPDH is used as an internal control to normalize the quantity of protein loaded. The data presented the density ratios of each protein to GADPH.