Figures & data
Table 1. Full factorial design showing the effect of process variables on size.
Table 2. Central composite design to study the effect of interaction between homogenization speed and homogenization time on mean particle size.
Table 3. Factorial design to study the effect of process variables on percentage drug encapsulation, size and zeta potential.
Figure 1. Contour plot showing the effect of process variables analyzed using factorial design on mean particle size. Effect of various levels of homogenization speed and PVA concentration on mean particle size when the level of drug–polymer ratio is maintained at a low level (a) and high level (b).
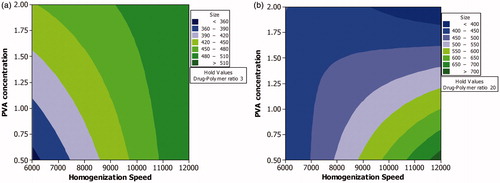
Figure 2. Surface and overlaid contour plot showing the effect of variables during CCD. (a) Surface plot showing the effect of interaction of homogenization speed and homogenization time on mean particle size. (b) Overlaid contour plot showing level of homogenization speed and homogenization time required to achieve particle size <500 nm.
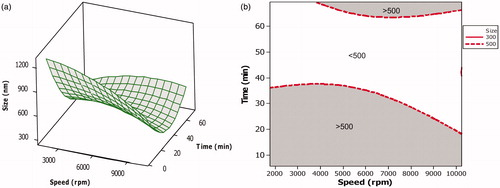
Table 4. The effect of process variables studied under factorial design on percentage drug encapsulation, size and zeta potential.
Figure 3. Effect of various levels of homogenization speed and PVA concentration on (a) percentage drug encapsulation, (b) mean particle size and (c) zeta potential when the level of curcumin-PCL ratio is maintained at highest level.
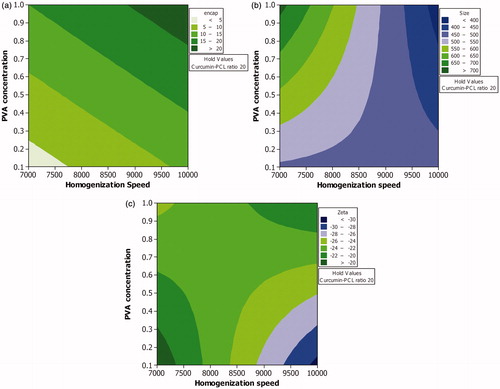
Figure 4. Mean particle size of curcumin-loaded PCL nanoparticles prepared under optimized condition.
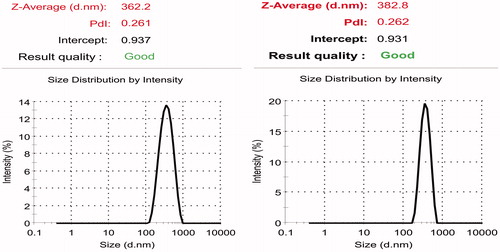
Figure 5. Zeta potential of curcumin-loaded PCL nanoparticles prepared under optimized condition.
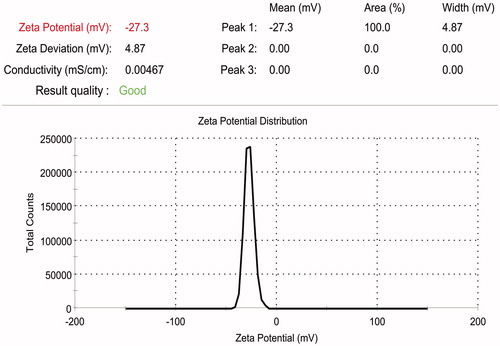
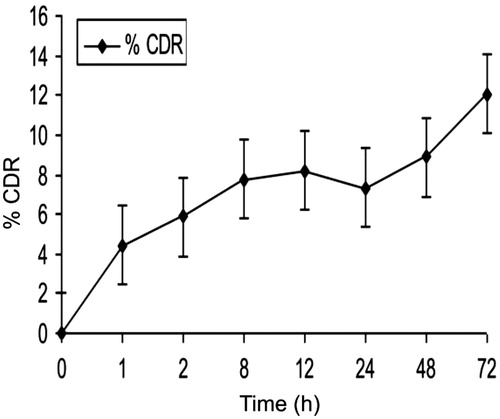
Figure 6. Percentage of drug released from curcumin-loaded PCL nanoparticles.
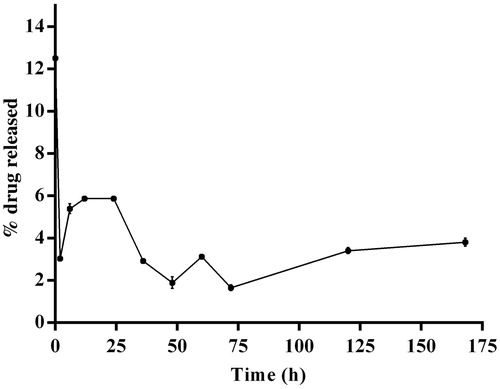
Figure 7. Effect of plain curcumin and curcumin-loaded PCL nanoparticles on (a) body weight and (b) mean survival time.
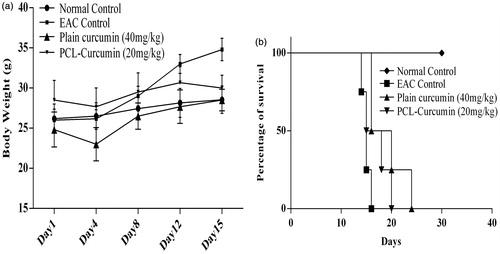
Figure 8. Effect of plain curcumin and curcumin-loaded PCL nanoparticles on hematological parameters (a) tumor volume, (b) hemoglobin level, (c) RBC level and (d) WBC level. *indicates that the treatment with plain curcumin and PCL-curcumin nanoparticles significantly (p-value < 0.05) controlled the proliferation of EAC cells.
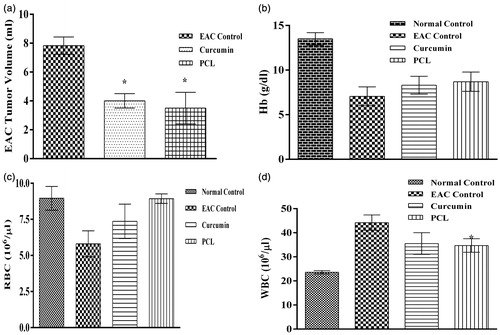
Figure 9. Cumulative percentage of drug released from the PLGA implant containing curcumin-loaded PCL nanoparticles.