Figures & data
Table 1. The 32 factorial design matrix (independent variables and their coded and actual levels; and the experimental results of responses(dependable variables) and other physicochemical characteristics of experimentally designed wafers.
Table 2. Experimental (OBS) and predicted values of ANN and RSM for chosen responses.
Figure 1. SEM photograph of the experimentally developed wafers.
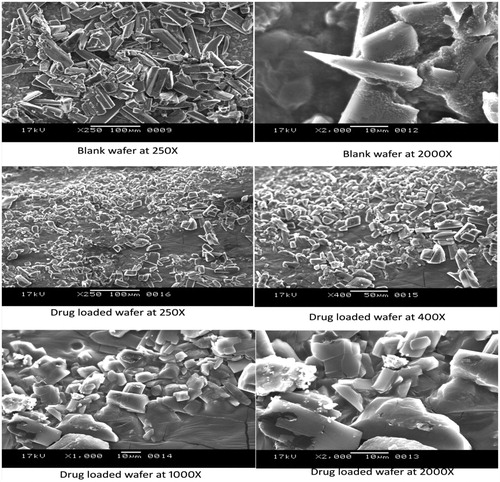
Figure 2. Cumulative % drug release versus time plot of wafers coded as FNA.
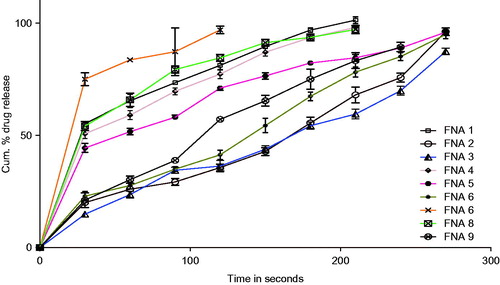
Table 3. Results obtained by fitting the experimental drug release data to the Korsmeyer–Peppas kinetic equation.
Figure 3. ANN MLP network architecture.
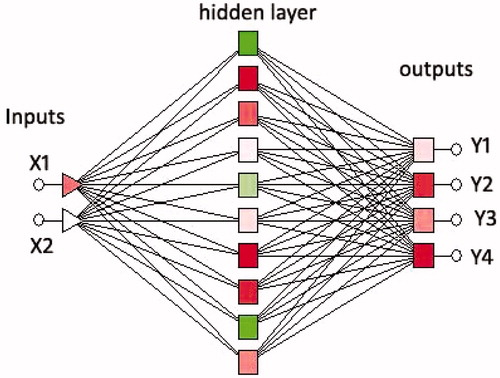
Figure 4. Plot of experimental data against predicted data given by ANN model for (a) disintegration time (b) % swelling index.
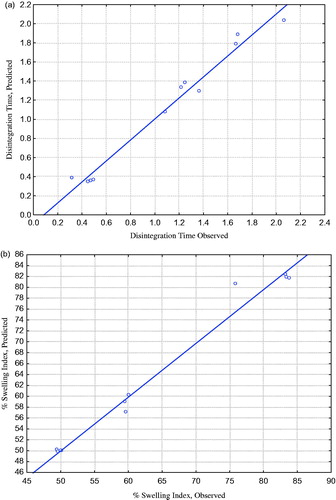
Figure 5. [a–d] Surface plots obtained from optimization of pharmaceutical wafers using ANN.
![Figure 5. [a–d] Surface plots obtained from optimization of pharmaceutical wafers using ANN.](/cms/asset/ce148238-5d88-49ed-9d5d-c84b6af97f5a/idrd_a_930759_f0005_c.jpg)
Figure 6. (a), (b), (c) and (d) show images of optimized drug-loaded wafers during contact angle measurement at different time points.
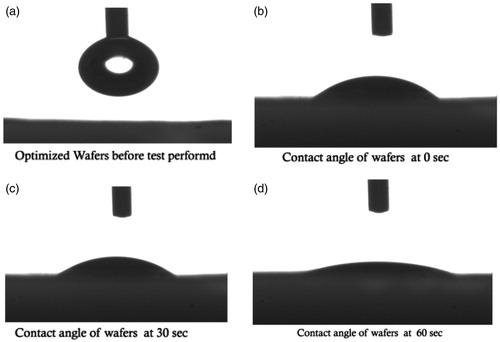
Figure 7. Plot of time versus SFE during contact angle measurement of the optimized wafer.
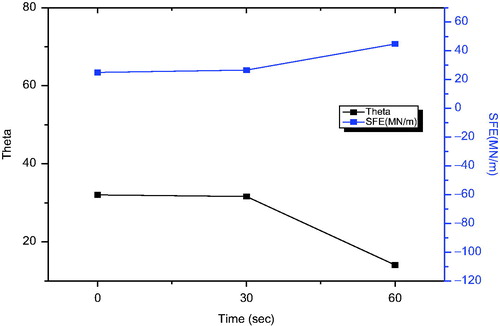
Figure 8. HPLC chromatograms obtain during pharmacokinetic study.
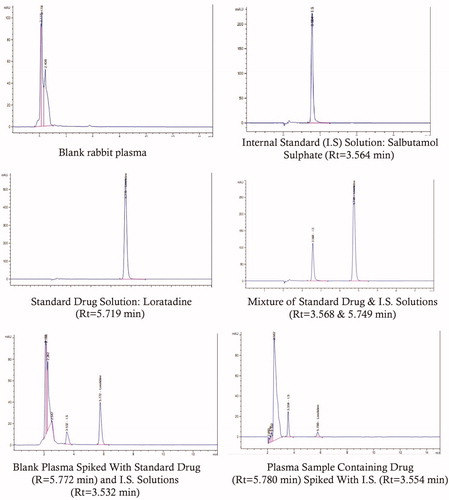
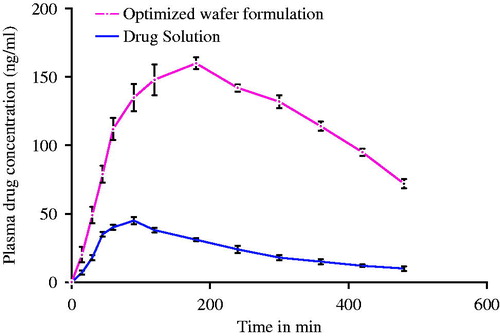
Figure 9. Plasma drug concentration versus time profile of Loratadine in rabbit plasma after administration of drug solution and optimized wafer orally.