Figures & data
Table 1. The physicochemical characterization of PTX-loaded polymeric micelles (n = 3).
Figure 1. XRD spectra of (a) PTX, (b) TS-CS-PEG-FA, (c) physical mixture of PTX and TS-CS-PEG-FA and (d) PTX-loaded TS-CS-PEG-FA.
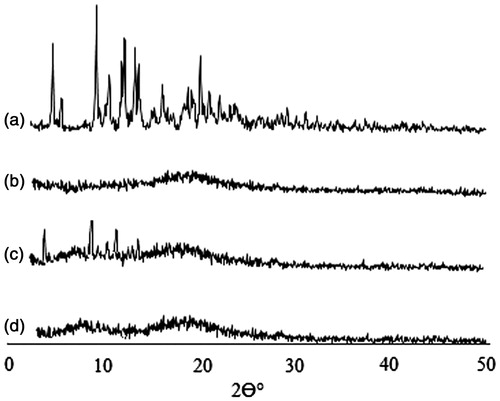
Figure 2. DSC spectra of (a) PTX, (b) TS-CS-PEG-FA, (c) physical mixture of PTX and TS-CS-PEG-FA and (d) PTX-loaded TS-CS-PEG-FA.
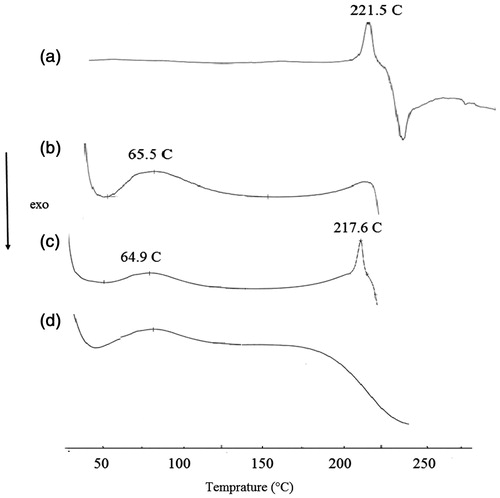
Figure 3. Fluorescence image after the cells were incubated with fluorescent (a) TS-CS micelles and (b) TSCS.
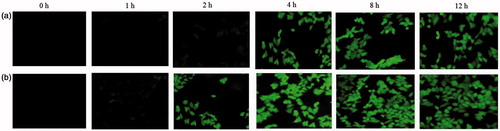
Figure 4. The cellular uptake percentage of FITC/CS-TS and FITC/TS-CS-PEG-FA micelles in 4T1 cells (the polymer concentrations were 20 μg/ml).
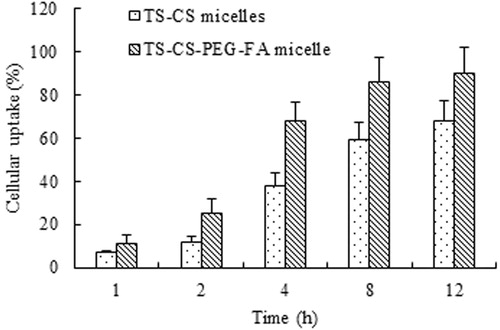
Figure 5. In vitro cytotoxicity of various PTX formulations and blank micelles against 4T1 cell line after 72 h incubation. Data were plotted as the mean ± SD of three measurements.
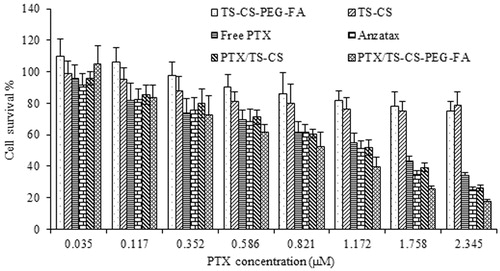
Figure 6. Effect of free folic acid on viability of 4T1 cells incubated with PTX/TS-CS-PEG-FA micelles at PTX concentration of 1.17 μM.
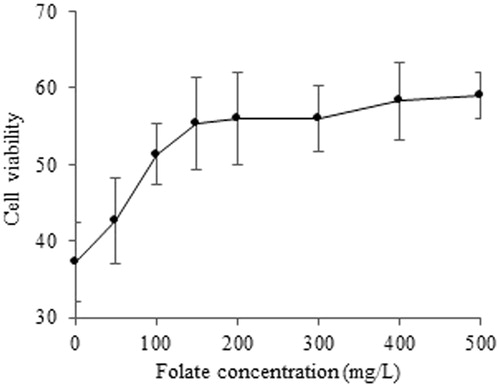
Figure 7. Tumor volume change in mice with PTX/TS-CS, PTX/TS-CS-PEG-FA, Anzatax®, blank micelles or saline (n = 6) (a) images of whole mice were taken at 25 days after tumor inoculation (b).
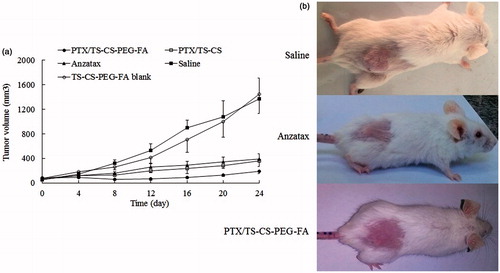
Figure 8. H&E-stained tumor slices from mice on the 25nd day after treatment with (a) saline, (b) Anzatax®, (c) PTX/TS-CS and (d) PTX/TS-CS-PEG-FA. Images were obtained under Olympus IX71 optical microscope.
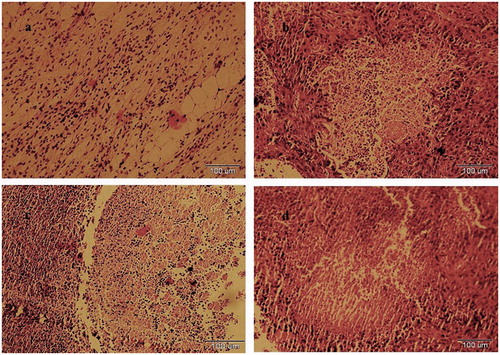
Table 2. In vivo anti-tumor effect of PTX formulations against 4T1 tumor in Balb/c mice (n = 6).
Figure 9. Mean concentration–time profile of PTX in Balb/c mice plasma after i.v. administration of Anzatax® and PTX/TS-CS-PEG-FA. Each point represents the mean ± SD (n = 3).
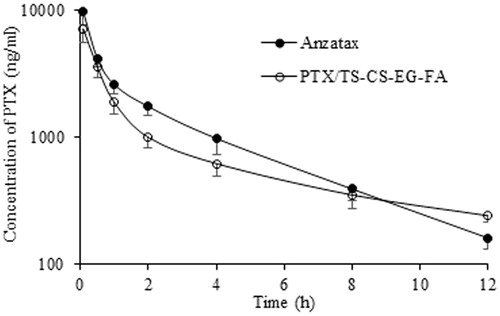
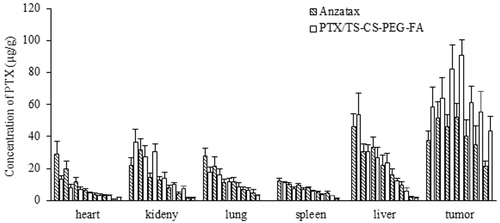
Figure 10. The PTX concentration in mice receiving Anzatax® or PTX/TS-CS-PEG-FA in tissues at different time points (0.083, 0.5, 1, 2, 4, 8 and 12 h) (mean ± SD, n = 5).