Figures & data
Table 1. Physicochemical properties of liposomes.
Table 2. Physicochemical properties of nanoparticles.
Figure 1. TEM images of (A) BMV-loaded; (B) DFV-loaded liposomes.
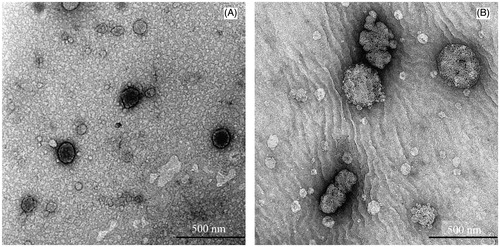
Figure 2. Amount of BMV accumulated from formulations in the stratum corneum + epidermis (dark bars) and dermis (light bars). *Significantly different from commercial cream and chitosan gel (p < 0.05).
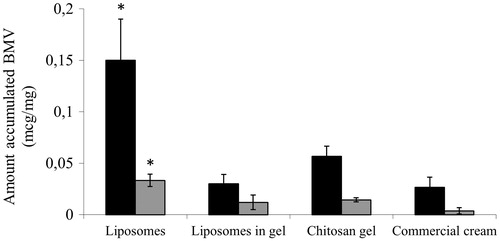
Figure 3. Amount of DFV accumulated from formulations in the stratum corneum + epidermis (dark bars) and dermis (light bars). *Significantly different from commercial cream and chitosan gel (p < 0.05).
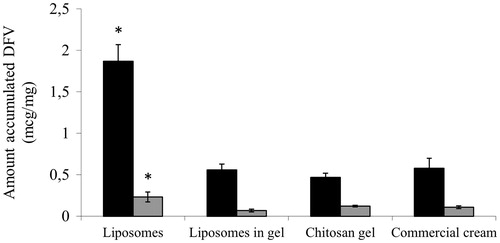
Figure 4. Potential effect of nanoparticles and liposomes on viability of human dermal fibroblast cells using MTT assay. Concentrations are the final concentration of active pharmaceutical ingredient in the incubation media. Bars represent “mean ± SD” from four seperate studies (n = 4). The numbers present on top of the bars are % cell viability compared to the control values. *p < 0.05; **p < 0.005 compared to the control values.
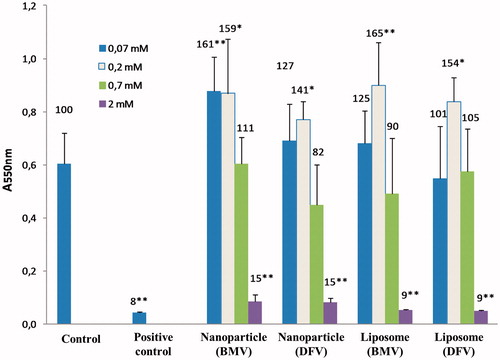
Figure 5. Changes in the paw thickness of the rats with respect to time after formulation application.
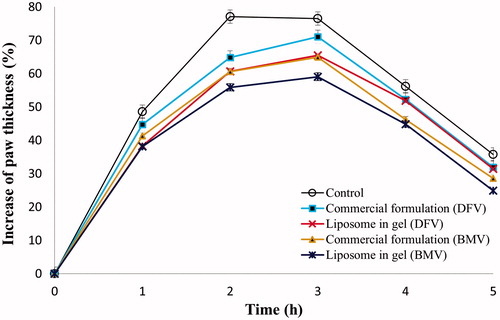
Figure 6. The morphological changes of different groups in rat dorsal skin. (A) healthy control, (B) atopy control, (C) BMV-loaded commercial cream, (D) BMV-loaded liposome in gel, (E) BMV-loaded nanoparticle in gel, (F) DFV-loaded commercial cream, (G) DFV-loaded liposome in gel, (H) DFV-loaded nanoparticle in gel.
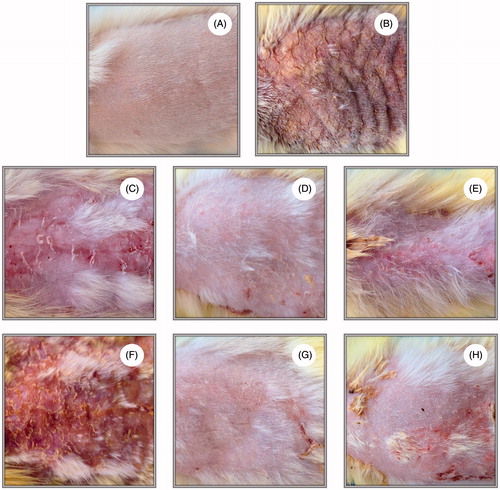
Figure 7. The histological changes of different groups in rat dorsal skin. (A) healthy control, (B) atopy control, (C) BMV-loaded commercial cream, (D) BMV-loaded liposome in gel, (E) BMV-loaded nanoparticle in gel, (F) DFV-loaded commercial cream, (G) DFV-loaded liposome in gel, (H) DFV-loaded nanoparticle in gel.
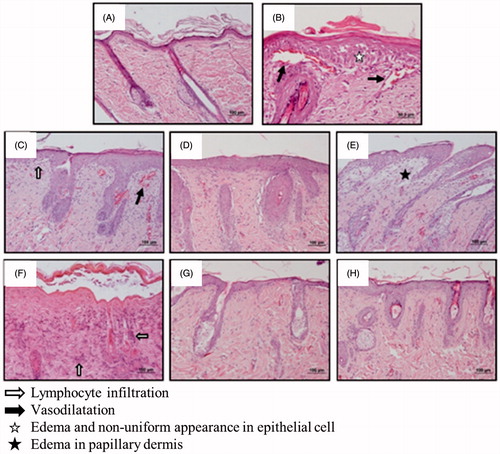
Figure 8. Images of infiltrated mast cells from tissue sections. (A) healthy control, (B) atopy control, (C) BMV-loaded commercial cream, (D) BMV-loaded liposome in gel, (E) BMV-loaded nanoparticle in gel, (F) DFV-loaded commercial cream, (G) DFV-loaded liposome in gel, (H) DFV-loaded nanoparticle in gel.
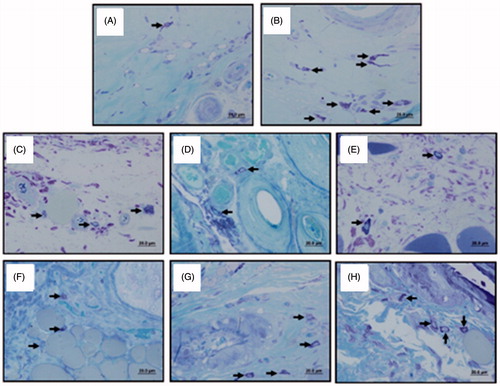
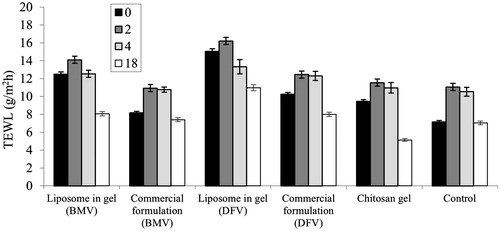
Figure 9. TEWL value changes of the groups with respect to time.