Figures & data
Figure 1. Schematic representation of establishment of immunoliposomes.
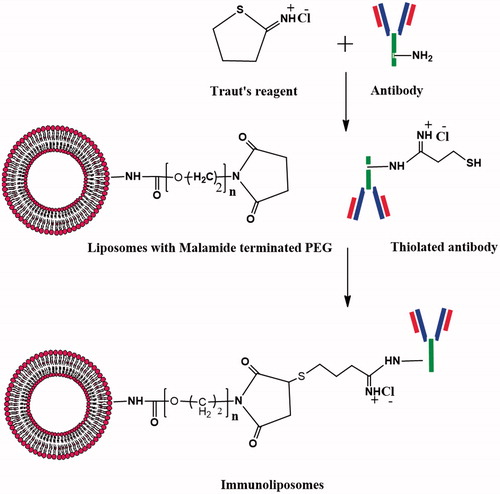
Figure 2. si-RNA encapsulation efficiency of liposome formed by different lipid ratios. (* < 0.05).
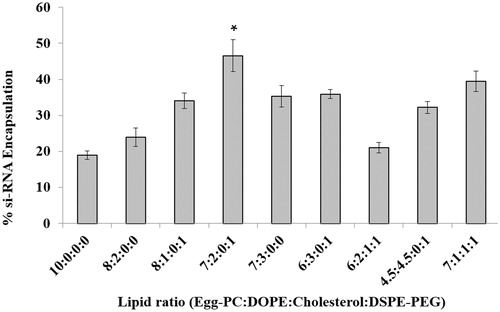
Table 1. Particle size, zeta potential and phase transition temperature of liposomes.
Figure 3. Zeta potentials of blank and si-RNA-loaded liposomes after 0, 30, 60 and 120 min of incubation at 37 °C (a) LA, (b) LB, (c) LC and (d) LD (* < 0.05).
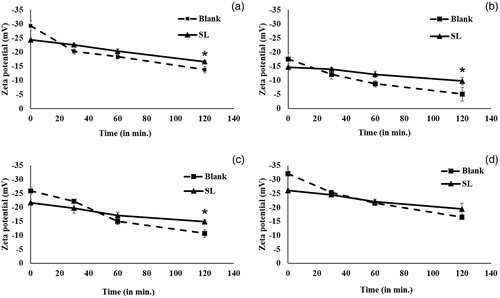
Figure 4. Protein adsorption and zeta potentials of blank and si-RNA-loaded liposomes (LA, LB, LC and LD) (a) Bovine serum albumin and (b) plasma protein adsorption after 24 h of incubation. (c and d) Zeta potential of the liposomes after 24 h incubation in PBS containing bovine serum albumin and plasma proteins (* < 0.05).
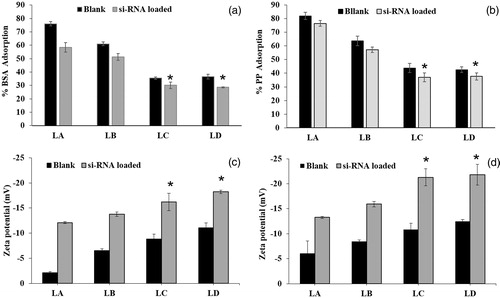
Figure 5. Colloidal stability of LA, LB, LC and LD liposomes in PBS, PBS containing BSA and PP after 24 h at 37 °C. BL: Blank and SL: siRNA-loaded liposomes in PES, BLA and SLA: in presence of BSA. BLPP and SLPP: in presence of Plasma protein.
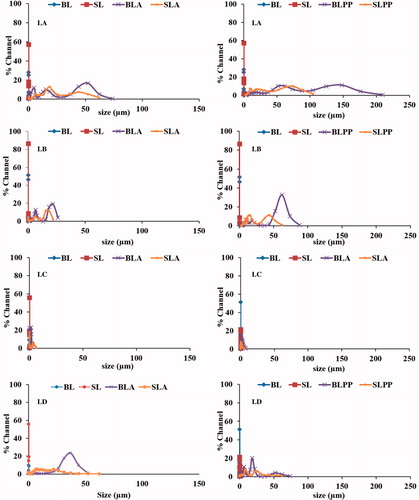
Figure 6. si-RNA release profile of LB, LC and LD lipomses (* < 0.05).
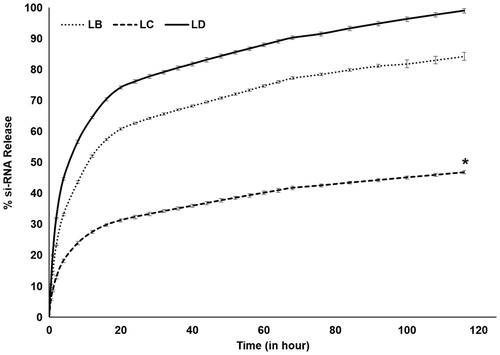
Table 2. FTIR vibration bands of liposomes and immunoliposomes.
Figure 7. Confocal images show the uptake of LC liposomes encapsulating fluorescent si-RNA at various time points by MCF-7 cells. Panel a illustrates the uptake of LC liposomes; Panel b illustrates the cell uptake of LC immunoliposomes intervals and Panel c illustrates the uptake of LC immunoliposomes by MCF-7 cells that have been pre-incubated with anti-EpCAM [Nucleolus: Blue (Hoechst), si-RNA: Green (Alexa flour488)].
![Figure 7. Confocal images show the uptake of LC liposomes encapsulating fluorescent si-RNA at various time points by MCF-7 cells. Panel a illustrates the uptake of LC liposomes; Panel b illustrates the cell uptake of LC immunoliposomes intervals and Panel c illustrates the uptake of LC immunoliposomes by MCF-7 cells that have been pre-incubated with anti-EpCAM [Nucleolus: Blue (Hoechst), si-RNA: Green (Alexa flour488)].](/cms/asset/02a41f2f-6962-4ba9-bfce-ea3f8fa73db7/idrd_a_973082_f0007_c.jpg)
Figure 8. (a) EpCAM silencing efficacy of LC liposomes and immunoliposomes with 100 and 200 nM si-RNA concentration after 48 h (* < 0.05), (b) Cell viability of LC liposomes and LC immunoliposomes.
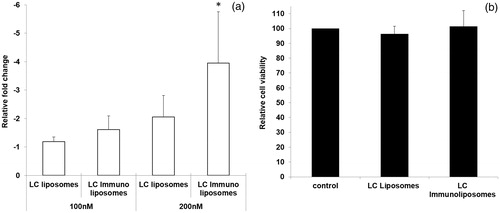
Figure 9. (a) Body weight of mice from different groups during treatment period, (b) tumor images weight after necrosis, (c) tumor volume during treatment period and (d) qRT-PCR data of EpCAM expression in tumor tissue (*<0.05).
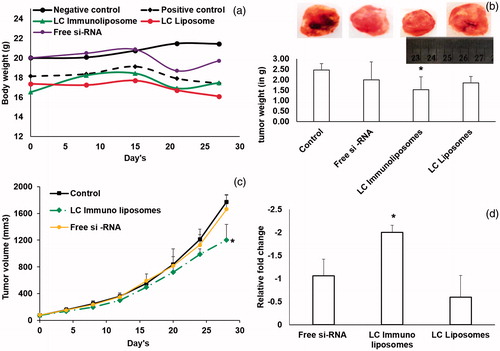
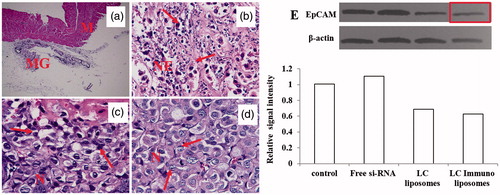
Figure 10. Histopathological staining images of (A) normal skin from negative control mice, (B) tumor tissue from positive control, (C) mice treated with Liposomes, (C) liposomes and (D) antibody linked liposomes group. Western blot showing EpCAM protein bands and the band intensity calculated using imagej software.