Figures & data
Figure 1. FTIR spectrum of FDCNs.
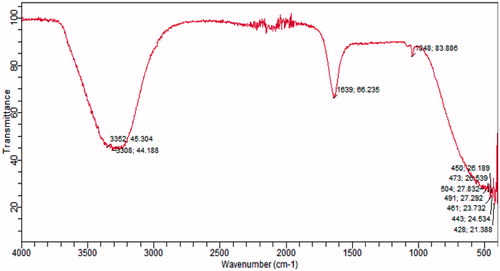
Table 1. Ingredients and concentration using in the formulation of nanoparticles (Mean ± S.D., n = 3).
Figure 2. Atomic force photomicrograph of FDCNs. (a) Single dimension image; (b) 3-D image of FDCNs.
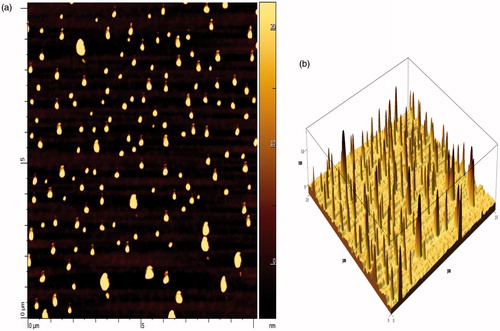
Table 2. Optimization study of different formulations of nanoparticles (Mean ± S.D., n = 3).
Figure 3. DSC thermogram of (a) 5-FU, (b) CAP, (c) Dextran, (d) FCNs, (e) FDCNs.
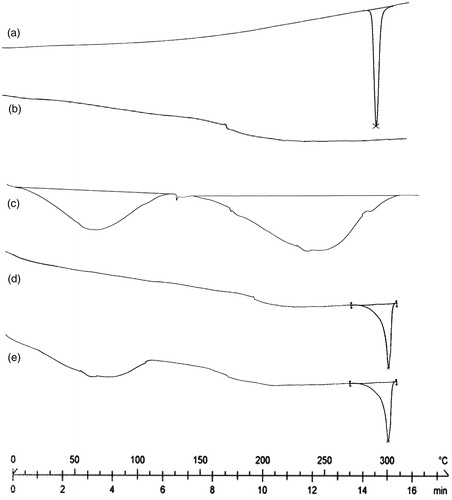
Figure 4. XRD of (a) 5-FU, (b) Dextran, (c) Cellulose Phthalate Acetate, (d) FCNs, (e) FDCNs.
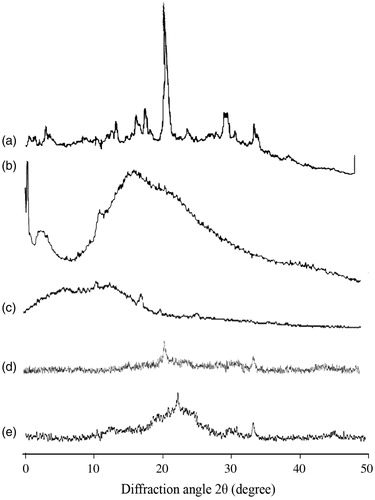
Figure 5. Percentage drug release form FCNs and FDCNs in PBS (pH 6.8).
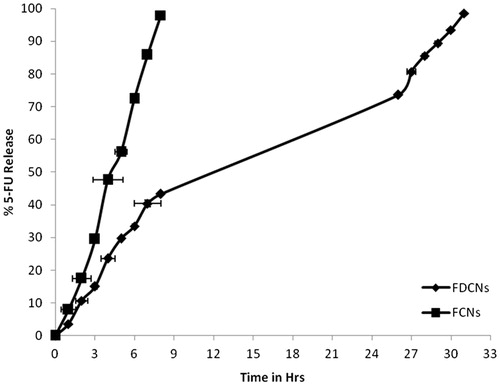
Figure 6. Percentage hemolysis of FCNs and FDCNs.
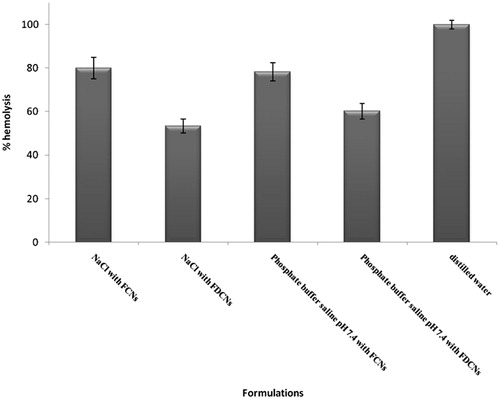
Figure 7. Percentage 5-FU percutaneous permeation profile through the excised rat skins of FDCNs.
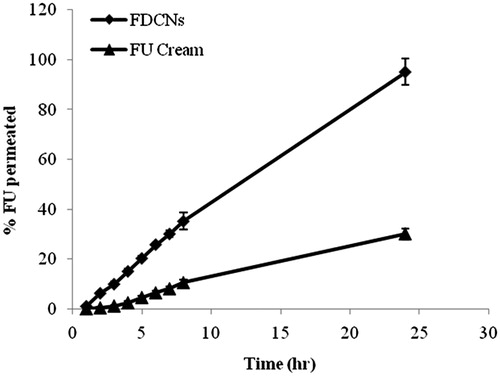
Table 3. In vitro permeation data of 5-FU from the FDCNs, FCNs and FU cream through newly born albino rats (Mean ± S.D., n = 3).
Figure 8. In vitro cytotoxicity of FDCNs and FU.
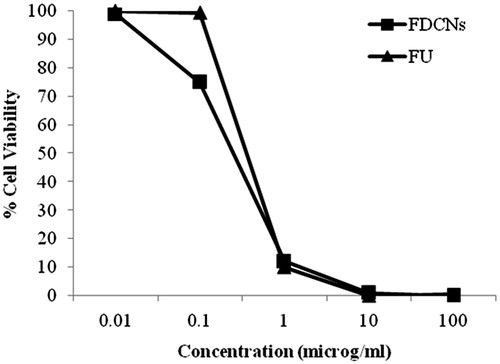
Figure 9. Blood concentration-time profile of 5-FU after applying transdermal cream containing dextran-coated CAP nanoparticles.
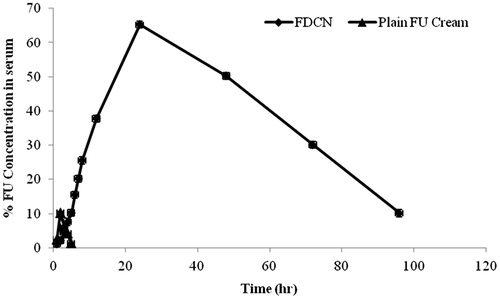
Table 4. Pharmacokinetic parameters of 5-FU from the FDCNs and FU cream through after topical administration albino rats (Mean ± S.D., n = 3).
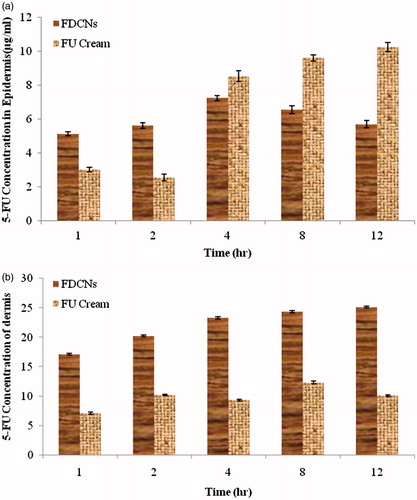
Figure 10. (a) Concentration of 5-FU in epidermis after topical application of FDCNs and FU cream; (b) concentration of 5-FU in dermis after topical application of FDCNs and FU cream.