Figures & data
Table 1. Composition and processing variables of different simvastatin-loaded niosomal formulations according to Placket–Burman screening design.
Table 2. Characterization of the prepared simvastatin-loaded niosomal formulations.
Figure 1. Pareto charts showing the standardized effect of the investigated variables on the studied responses. Q 1 h and Q 12 h are percentage of simvastatin released after 1 and 12 h, respectively. X1–8 are surfactant loading in moles, surfactant chain length, cholesterol loading in moles, charging agent type (negative charge), percentage of charging agent, sonication time in seconds, sonication amplitude and drug loading in moles, respectively. *-refers to a description for the abbreviations “Q 1h and Q 12h”.
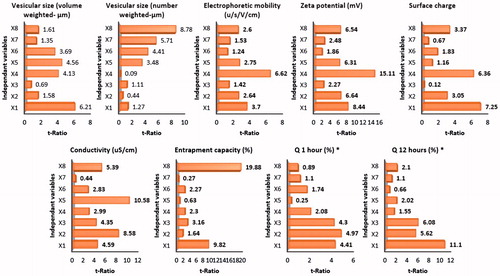
Table 3. Results of multiple regression analysis for prediction of the investigated responses.
Figure 2. Quantile–quantile and predicted versus the residuals plots for predicting the investigated responses. (Size-No wted is the number-weighted vesicular size; Q 12 h is percentage of simvastatin released after 12 h).
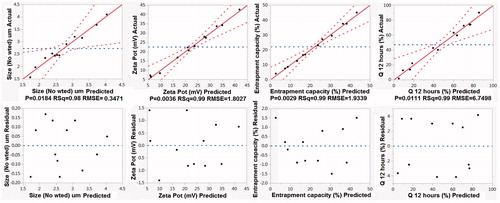
Figure 3. Response surface and contour plots of selected significant factors on the responses. (Size-No wted is the number-weighted vesicular size; Q 12 h is percentage of simvastatin released after 12 h).
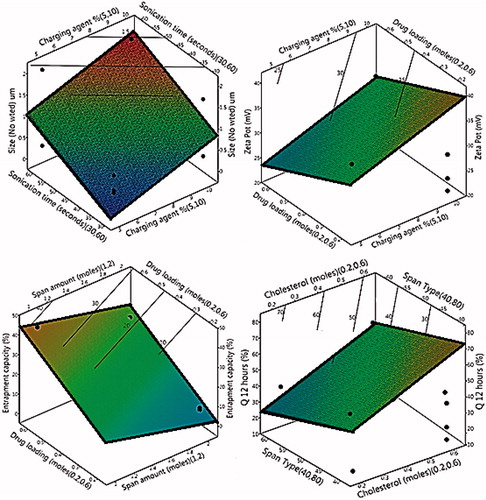
Figure 4. (A) Release profiles of simvastatin from the 12 niosomal formulations using Franz diffusion cells (dialysis membrane MWCO 20 kDa cellulose ester, 10 mM phosphate buffer (pH 6.8) containing 0.05% sodium dodecyl sulfate, 37 °C, 300 rpm, n = 3). Standard deviation did not exceed 5% of the release percentage at each time point. (B) and (C) TEM and SEM of the prepared niosomal vesicles of highest simvastatin release (F10), respectively.
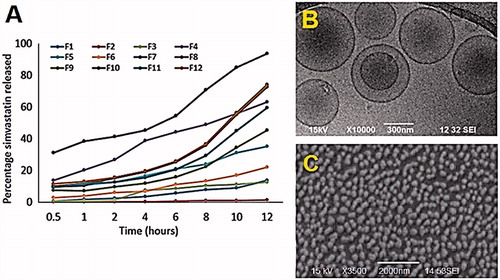
Table 4. Summary of ANOVA testing for evaluating the significance of the model in portions.
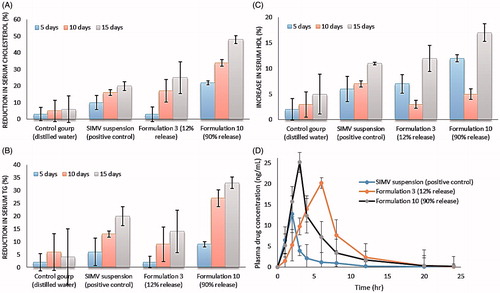
Figure 5. (A), (B) and (C) percent changes in serum cholesterol, TG and HDL levels of experimental groups at different time intervals. (D) Plasma drug concentrations–time profiles of oral simvastatin suspension and its transdermal niosomal formulations of lowest and highest drug release rates (F3 and F10).