Figures & data
Figure 1. Drug solubility in various vehicles. (1) Capryol™ PGMC, (2) Capryol™ 90, (3) Lauroglycol-FCC, (4) castor oil, (5) Labrafil M1944CS, (6) Labrafil M2125 CS, and (7) Peceol. Data represent the mean ± standard deviation (n = 3).
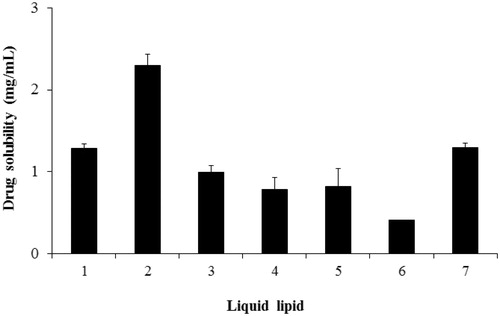
Figure 2. Effect of compositions on formulation parameters: particle size, polydispersity index (PDI), and zeta potential (ZP). (A) Liquid lipid concentration, (B) lipid concentration, (C) Tween 80 concentration, (D) drug concentration. Data are expressed as the mean ± standard deviation (n = 3).
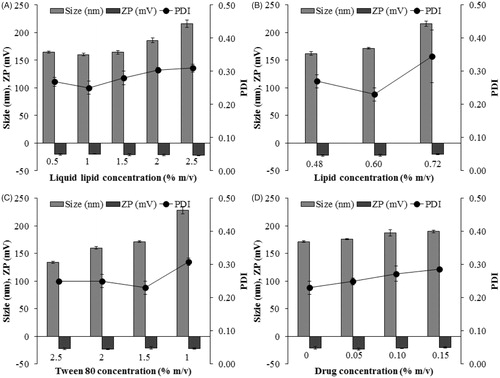
Table 1. Compositions of VRS-NLCs.
Figure 3. Drug entrapment efficiency and loading capacity.Data are expressed as the mean ± standard deviation (n = 3).
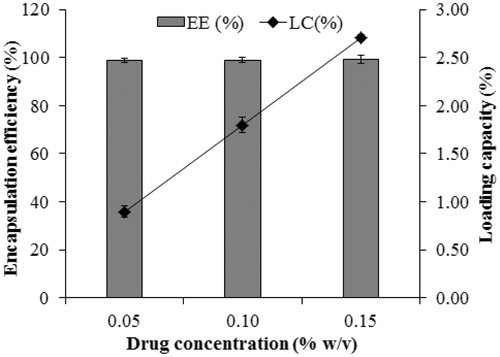
Figure 4. TEM image of VRS-NLCs.
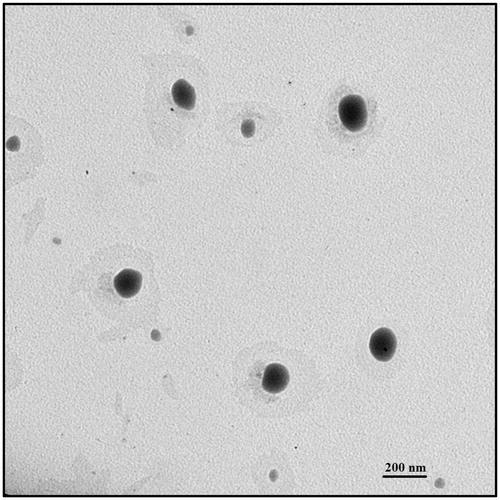
Figure 5. (A) Differential scanning calorimetric (DSC) thermograms and (B) X-ray diffraction (XRD) patterns of solid lipid, free VRS, and VRS-NLCs.
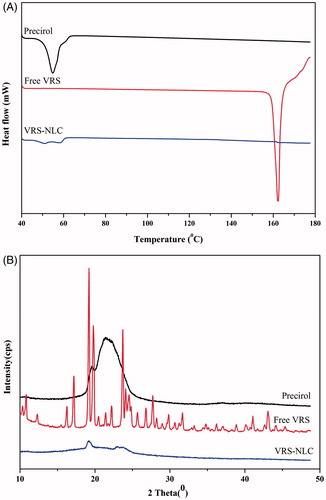
Figure 6. In vitro drug release from VRS-NLCs under different conditions: pH 1.2 (Δ) and pH 6.8 (•).
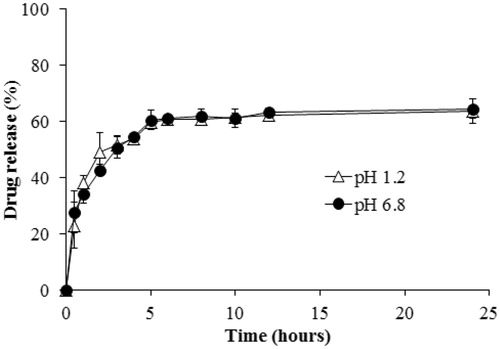
Figure 7. Intracellular uptake of NLCs in (A) SCC-7 cell, and (B) MCF-7 cells. NLCs contain NBD-PC (green) as a fluorescent probe. The LysoTracker Red stained for lysosome (red).
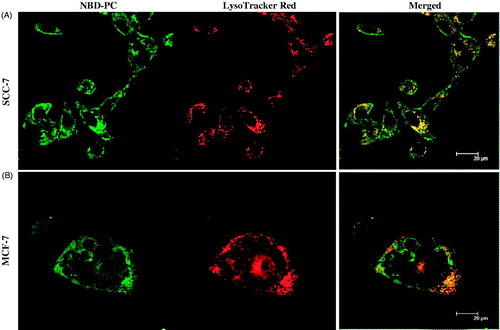
Figure 8. Cell viability following exposure of MCF-7, A549, and SCC-7 cells to blank NLCs, free VRS, and VRS-NLCs for 24 h. Data are expressed as the mean ± standard deviation (n = 8).
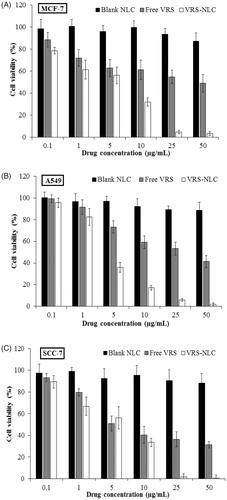
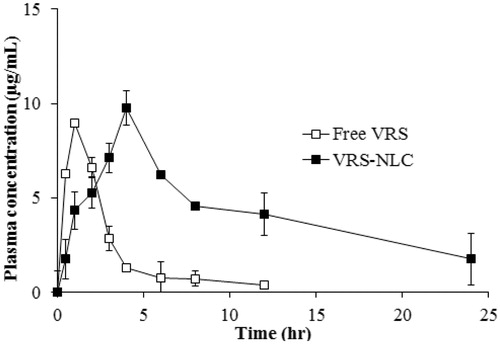
Figure 9. Plasma concentration-time profile of VRS after oral administration at a dose of 30 mg/kg of free VRS (□) or VRS-NLCs (▪). Data are expressed as the mean ± standard deviation (n = 4).