Figures & data
Table 1. Characterizations of different liposome formulations.
Figure 1. Photograghs of DMA with Trypan blue in microneedle tips. (A) Overhead view of DMA by digital camera; (B) dark-field micrograph of a single microneedle.
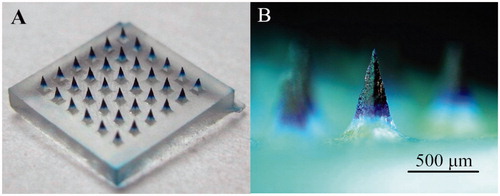
Figure 2. (A) The images of DMA before and after force application. (B) The images of skin surface after treated with DMA and dyed with Trypan blue.
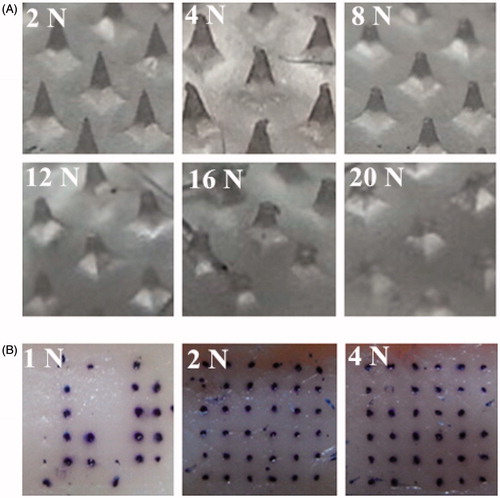
Figure 3. Micrograph of DMA after inserted into the mouse skin in vitro and stayed for different time. After removal of the DMA, the residual microneedles were photographed in dark field by microscopy (10 × 5).
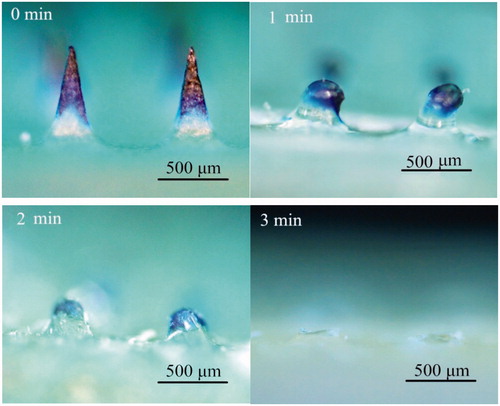
Figure 4. Expression of pGFP in skin after DMA application. (A) Negative control without pGFP loaded; (B) 1 day after Lip+pGFP loaded DMA application; (C) 4 days after Lip+pGFP loaded DMA application; (D) 7 days after Lip+pGFP loaded DMA application.
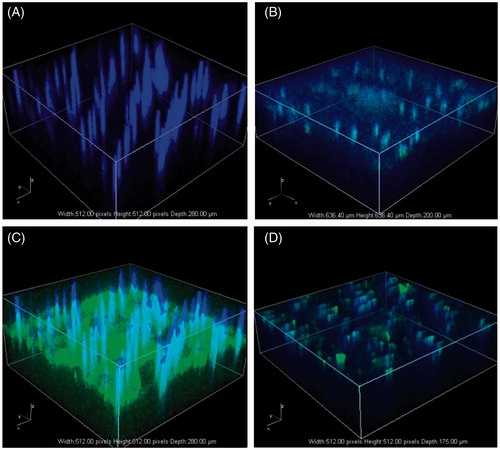
Figure 5. IgG titers induced by different immunized routes (n = 6).
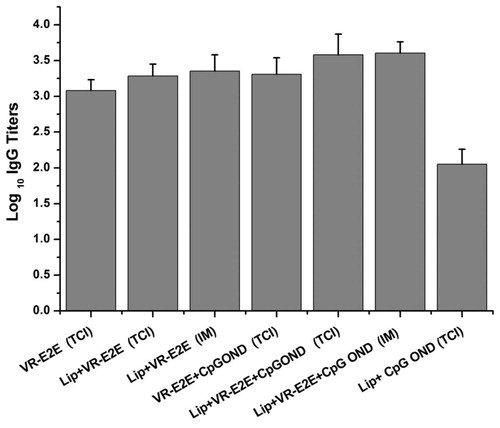
Figure 6. TCI used DMA with difference dose.
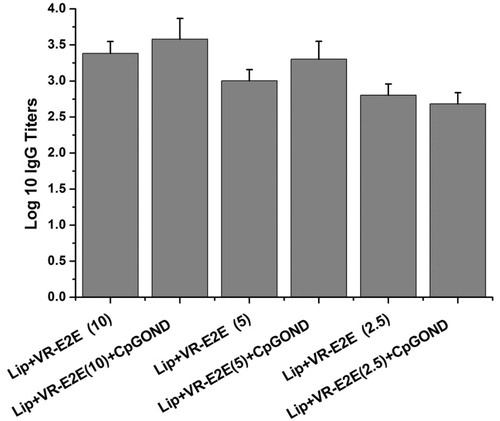
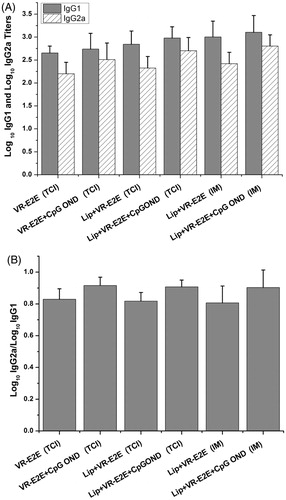
Figure 7. Anti-HBs specific IgG1 and IgG2a titers. (A) The log10 IgG1 and IgG2a titers. (B) The IgG2a/IgG1 ratio.