Figures & data
Table 1. Composition of ethosomal formulae.
Table 2. The % of vancomycin hydrochloride in ethosomal formulae after continuous exposure for 12 h to 0.5 mA/cm2 current.
Figure 1. Permeation profile of vancomycin hydrochloride from free drug solution and different ethosomal formulae with/without iontophoresis.
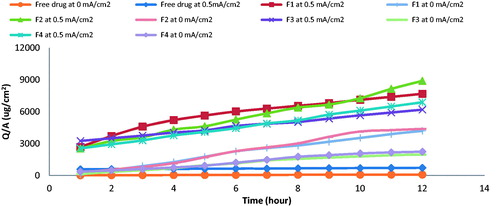
Figure 2. Transdermal flux (Jss) of free drug and ethosomal formula at 25 mg/ml drug concentration, 0 mA/cm2, 0.5 mA/cm2 and continuous current density (n = 3, error bars represent S.D. values).
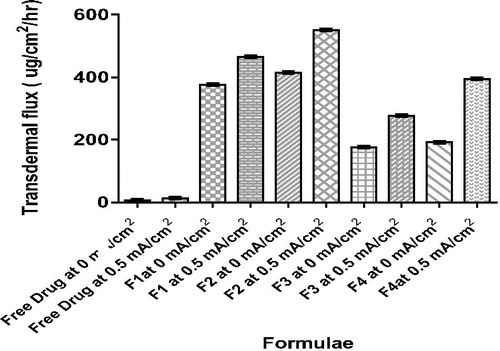
Table 3. Permeation parameters of vancomycin hydrochloride as free drug and from ethosomal formulae combined with iontophoresis at 0 and 0.5 mA/cm2 current.
Figure 3. Effect of current mode on transdermal flux of F2 at same experimental conditions (n = 3, error bars represent S.D. values).
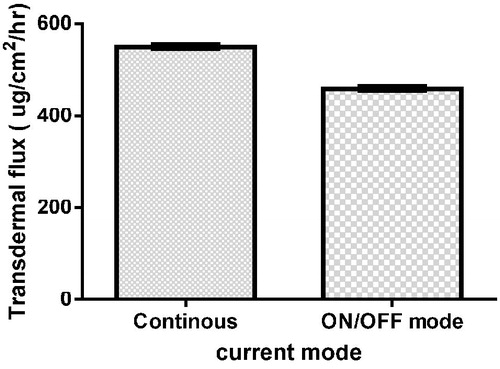
Figure 4. Effect of current density on transdermal flux of F2 at same experimental conditions (n = 3, error bars represent S.D. values).
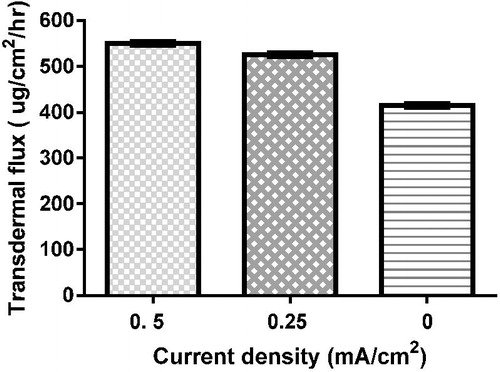
Figure 5. Effect of concentration on transdermal flux of F2 at same experimental conditions (n = 3, error bars represent S.D. values).
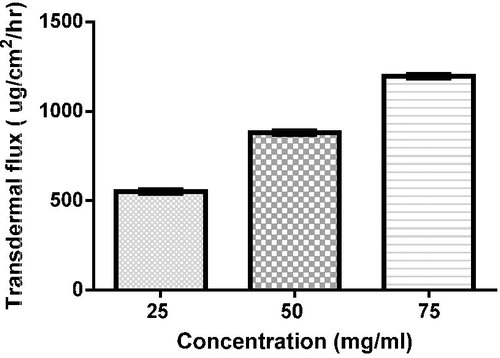
Figure 6. Effect of drug solvent on transdermal flux of F2 at same experimental conditions (n = 3, error bars represent S.D. values).
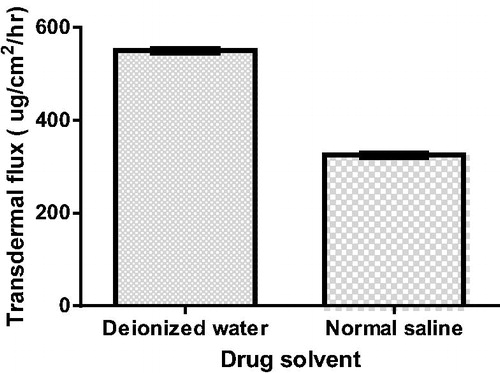
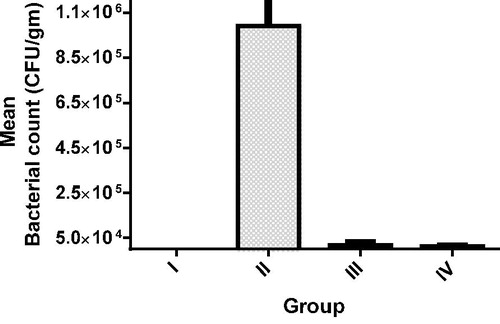
Figure 7. Mean bacterial count of rat groups (n = 6, error bars represent S.D. values).