Figures & data
Figure 1. Schematic diagram of the delivery of drugs into a cell. At physiological pH, the peptide–drug conjugates interact weakly with a membrane. At low pH, the peptide forms a transmembrane helix with its C-terminus inserted in the cytoplasm, the intracellular reductive environment breaks the disulfide bond to release the drug.
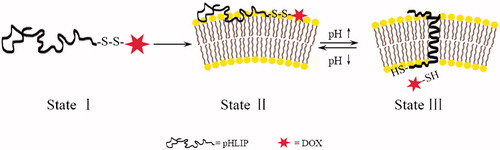
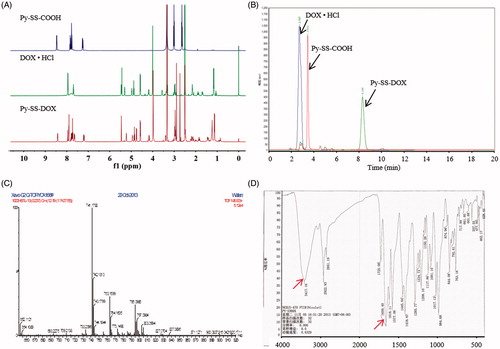
Figure 2. Characteristics of Py-SS-DOX. 1H NMR spectra (A) and HPLC spectra (B) of DOX·HCl, Py-SS-COOH, Py-SS-DOX. ESI/MS spectrum (C) and FTIR spectrum (D) of Py-SS-DOX.
Scheme 1. Synthetic routes. Reagents and conditions: (i) Ethanol/AcOH, rt, 2–3 h; (ii) DMF, HBTU, DIEA, rt, 12 h; (iii) DMF, rt, 48 h.
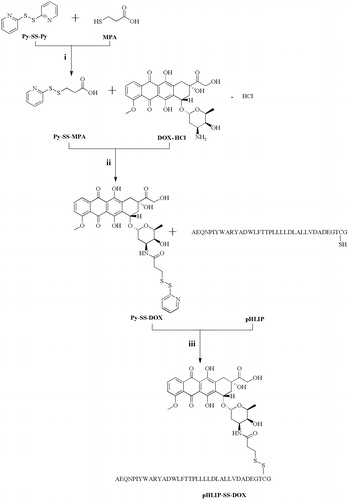
Figure 3. Characteristics of pHLIP-SS-DOX and DOX-SS-DOX. (A) MALDI-TOF spectra of pHLIP, pHLIP-SS-DOX, (B) HPLC spectra of Py-SS-DOX, pHLIP, pHLIP-SS-DOX, (C) UV spectra of DOX, pHLIP-SS-DOX. And (D) ESI/MS spectrum of DOX-SS-DOX.
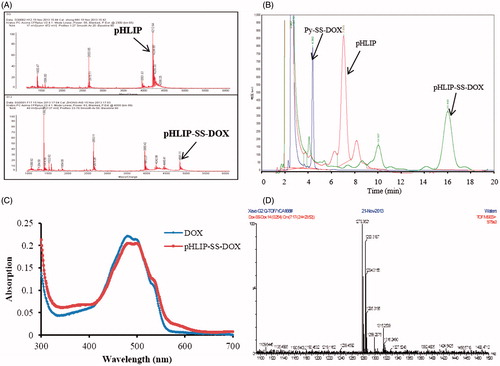
Figure 4. Verification of pHLIP's property. Trp fluorescence (A) and CD (B) spectra of pHLIP. Blue line represents fluorescence and CD spectra of pHLIP at pH 8.0 in the absence of liposomes; red, after 30 min of incubation with liposomes at pH 8.0; purple, after incubation with liposomes at pH 4.0. (C) was the interactions between FITC-pHLIP and MCF cells at different conditions for 3 h. Left, pH=7.4; right, pH=6.0.
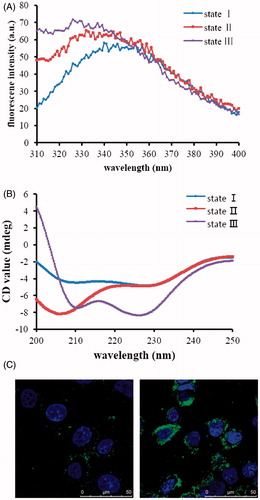
Figure 5. LDH tests of pHLIP-SS-DOX at different pH conditions on MCF-7 cells for 3 h (A) and in vitro flow cytometry analysis of the uptake of DOX, pHLIP-SS-DOX, Py-SS-DOX, DOX-SH on MCF-7 (B) and MCF-7/Adr (C) cells for 3 h. The concentrations of the conjugates are all 7 μM. *p < 0.05 uptake at pH 6.0 versus uptake at pH 7.4, ***p < 0.001 uptake at pH 6.0 versus uptake at pH 7.4.
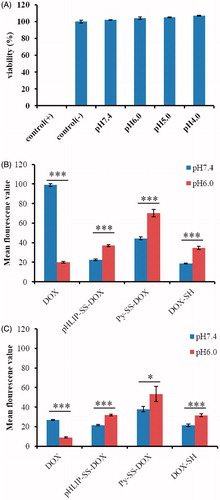
Figure 6. Laser scanning confocal analysis of the uptake of DOX, pHLIP-SS-DOX, Py-SS-DOX, DOX-SH on MCF-7 cells (A, B) and MCF-7/Adr (C, D) cells at pH 7.4 (A, C) or pH 6.0 (B, D) for 3 h. The concentrations the conjugates are all 7 μM.
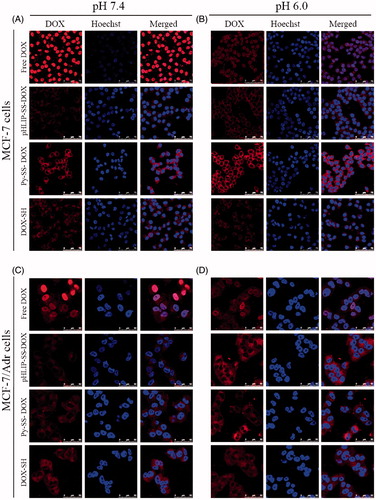
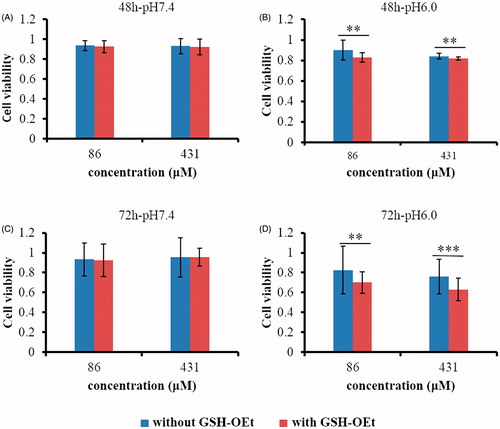
Figure 7. GSH-OEt mediated cytotoxicity against MCF-7 cells after incubation with pHLIP-SS-DOX. Cells were treated with 10 mM GSH-OEt for 2 h before the following treatment with pHLIP-SS-DOX for 48 h or 72 h at pH 7.4 or pH 6.0. **p < 0.01 cell viability without GSH-OEt versus cell viability with GSH-OEt, ***p < 0.001 cell viability without GSH-OEt versus cell viability without GSH-OEt.