Figures & data
Figure 1. Structure of triptolide.
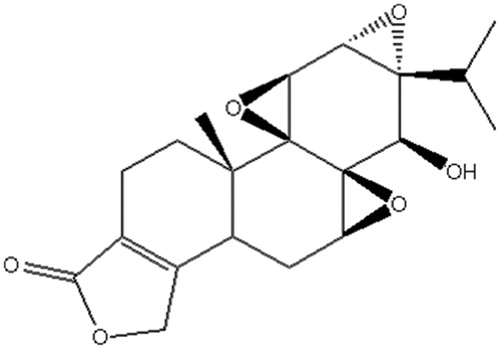
Figure 2. Appearance of TP-LE.
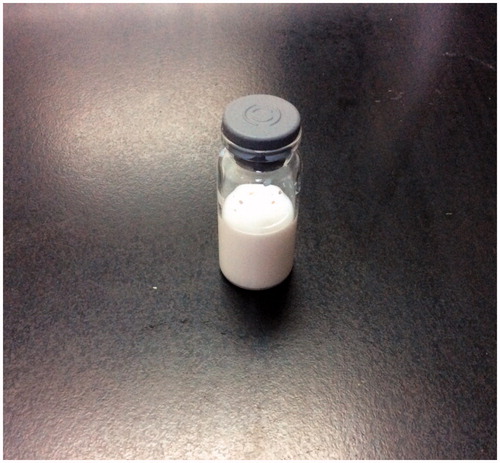
Figure 3. Transmission electron microscopy (TEM) of TP-LE at ×20 000 magnification.
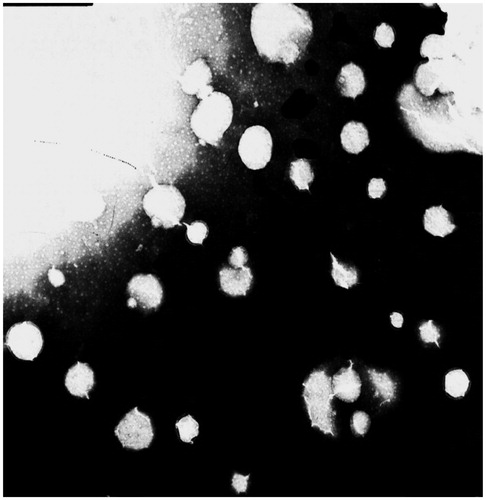
Figure 4. Particle size and distribution of TP-LE.
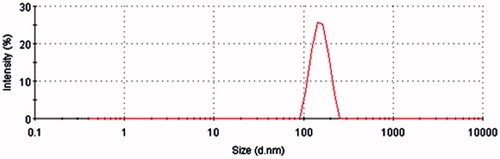
Figure 5. Zeta potential and distribution of TP-LE.
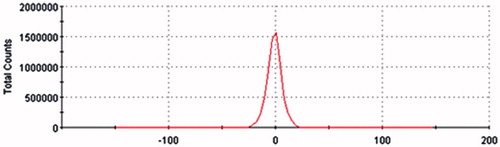
Table 1. Stability data of TP-LE.
Figure 6. Representative chromatograms of blank plasma (A), plasma sample spiked with TP and IS (B) and plasma sample collected at 5 min after a single i.v. administration of TP at the dose of 1.25 mg/kg (C). Peak I: TP, peak II: IS.
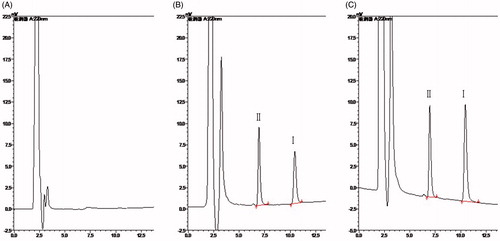
Figure 7. Representative chromatograms of blank liver (A), blank liver tissue spiked with TP and IS (B) and liver tissue collected at 5 min after a single i.v. administration of TP at the dose of 1.25 mg/kg (C). Peak I: TP, peak II: IS.
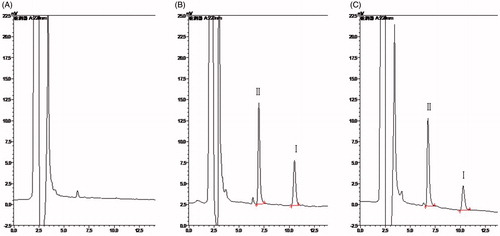
Table 2. Standard curves of TP in plasma and tissues.
Table 3. Precision and accuracy data of TP in plasma and tissues.
Table 4. Stability of TP in plasma and tissues (n = 5, mean ± SD, %).
Figure 8. Plasma concentration–time profiles of TP and TP-LE in mice after i.v. administration of TP and TP-LE at the dose of 1.25 mg/kg (n = 6, mean ± SD).
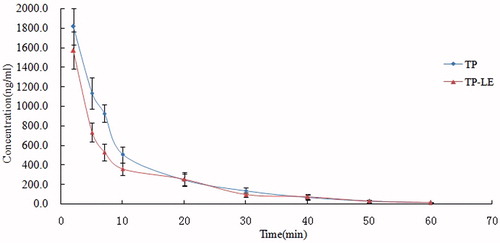
Table 5. Pharmacokinetic parameters of TP and TP-LE in mice after i.v. administration of TP and TP-LE at the dose of 1.25 mg/kg (n = 6, mean ± SD).
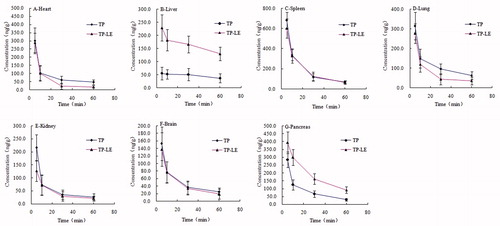
Figure 9. Concentrations of TP-LE (A) and TP (B) in mice tissues at 5, 10, 30 and 60 min after i.v. administration of TP-LE and TP at the dose of 1.25 mg/kg (n = 6, mean ± SD).
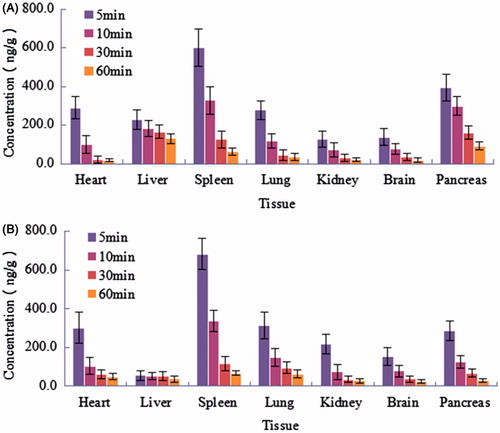
Figure 10. Tissue distribution curves of TP-LE and TP in mice after i.v. administration of TP-LE and TP at the dose of 1.25 mg/kg (n = 6, mean ± SD).