Figures & data
Table 1. Composition of different docetaxel LNEs.
Table 2. Physical characters of the prepared DLNEs (n = 3).
Table 3. Estimation of amount of albumin bound to each globule of docetaxel LNE.
Figure 1. In vitro drug release profiles of DS, DLNE, SALNE and ALNE formulations (n = 3).
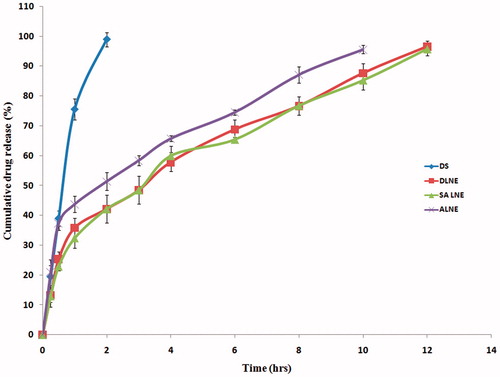
Figure 2. In vitro cytotoxic study-a comparison of IC50 values of DLNE on Hela and MCF-7 cell lines (Mean ± SD, n = 6). (DLNE: Docetaxel lipid nanoemulsion, SALNE: stearyl amine containing lipid nanoemulsion, ALNE: albumin containing lipid nanoemulsion, DS: drug solution).
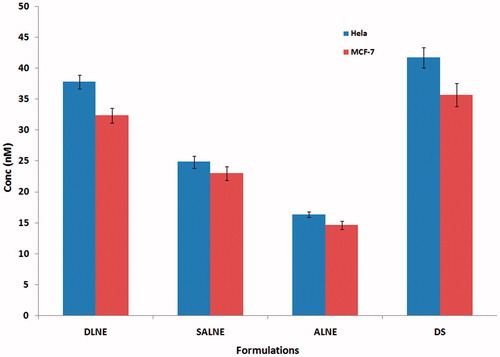
Figure 3. Fluorescence emitted from the mice after 6 h of administration of different LNEs. (Note: Encircled areas depict the tumors. The increased fluorescence intensity is observed when compared with control animal (before treatment), after the administration of DiD oil-loaded DLNE, SALNE and ALNE.
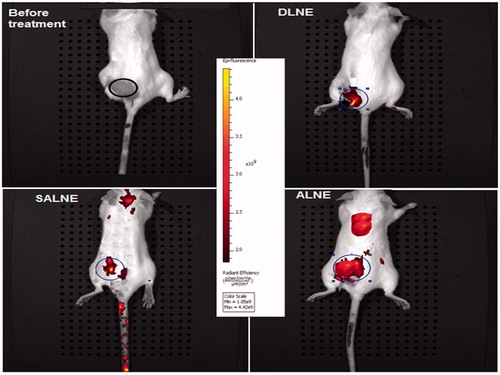
Figure 4. A comparison: fluorescent images of the major organs/tissues after 6 h of administration of different LNEs in tumor-induced mice.
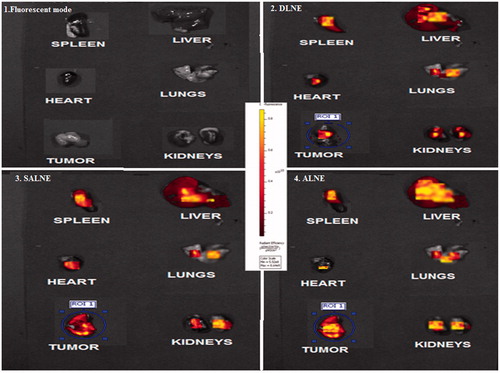
Table 4. Average radiance values of the major organs/tissues after 6 h of administration of different docetaxel LNEs (n = 3) containing fluorescent DiD oil.
Figure 5. Progressive tumor volume reduction after weekly treatments with various LNEs (n = 6).
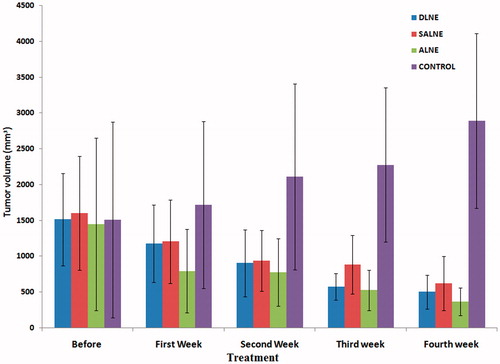
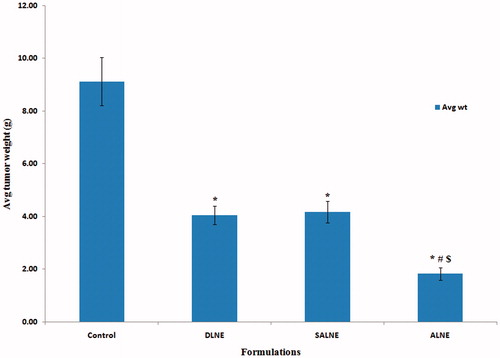
Figure 6. Bar diagram showing a comparative reduction in final tumor weights after four treatments with various LNEs (n = 6). Note: *Statistically significant when compared with control at p < 0.01. #Statistically significant when compared with DLNE at p < 0.01. $Statistically significant when compared with SALNE at p < 0.01.