Figures & data
Figure 1. Schematic representation of how PSA micelles loaded with mRNA was delivered to APCs. PSA/mRNA nanoparticles were hypothesized to translate into protein, thus can lead to CD4+ and CD8+ T cell response. Gag mRNA alone can also induce immune response by interaction with the TLRs.
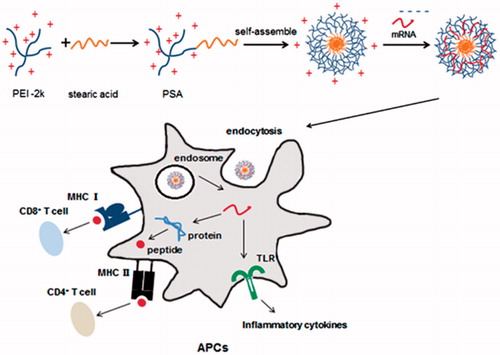
Figure 2. (A) Schematic representation of pVAX1-gag used in the study. The in vitro transcription template contained human β-globin-specific 5′ and 3′ UTRs and a 30 nucleotide-long poly A tail. The start (AUG) and stop (UAA) codons were added. (B) Detection of mRNAs. In vitro transcripts were tested in 4% nuclease-free agarose gel. The position and size of the mRNAs were indicated. (C) Gel retardation assay of PSA/mRNA polyplexes in 4% nuclease-free agarose gel. Polyplexes were prepared at different weight to weight ratio of PSA/mRNA. Naked mRNA was the control without any complexation.
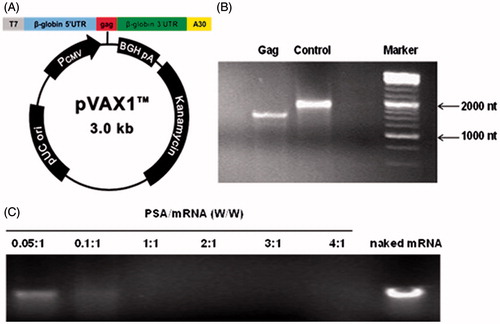
Figure 3. Morphology and size distribution of PSA and PSA/mRNA nanoparticles were evaluated at PSA:mRNA (W/W)ratio of 4. (A) Size and distribution of PSA/mRNA nanoparticles by intensity. TEM image of (B) naked PSA and (C) PSA/mRNA nanoparticles (1% phosphotungstic acid-negative staining).
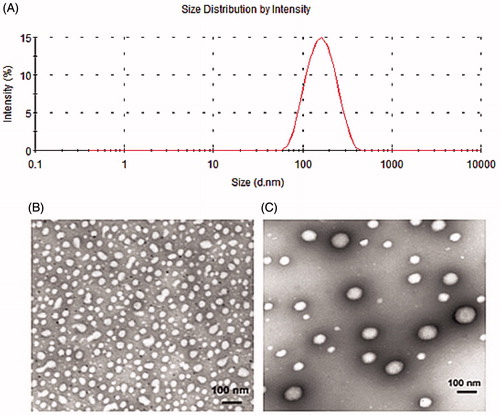
Figure 4. Cytotoxicity and cell uptake of PSA/mRNA nanoparticles. (A) Cell viability of PEI polymers was determined on DC2.4 cells. Untreated cells were defined as 100% viability cells. Data are presented as mean ± SD (n = 3), **p < 0.01, ***p < 0.005. (B) Flow cytometry analysis for cell uptake efficiency of Fl-mRNA complexed with PEI-2k, PSA or PEI-25k at the indicated mass ratio after incubation with DC2.4 cells for 2 h. (Data are shown as mean ± SD (n = 3). ***p < 0.005) (C) Confocal laser scanning microscopy showed the endosome escape of PSA/Fl-mRNA nanoparticles. DC2.4 cells were incubated with Fl-mRNA complexed with PSA for the indicated times. Green fluorescence was Fl-mRNA and red fluorescence was endosome stained with Lyso-tracker, yellow fluorescence was the co-localization site of the Fl-mRNA and endosome.
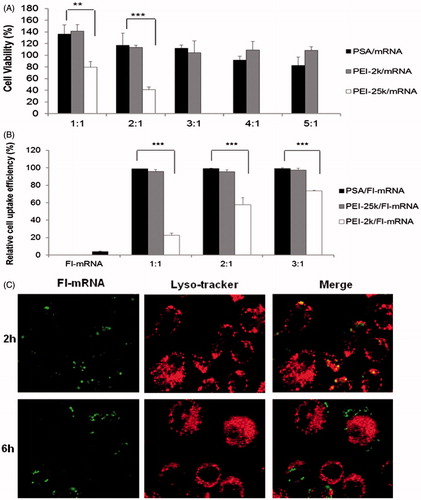
Figure 5. DC2.4 cells after transfection with (A) PEI-25k/mEGFP W/W=4, (B) PSA/mEGFP W/W=4 and (C) naked mEGFP. (D) Transfection efficiency of naked mGag and the indicated PEI complexes. Transfection efficiency of cells treated with PSA/mEGFP was consistently significantly higher as compared to that of PEI-2k/mEGFP at the indicated mass ratio. (Data are shown as mean ± SD (n = 3). ***p < 0.005).
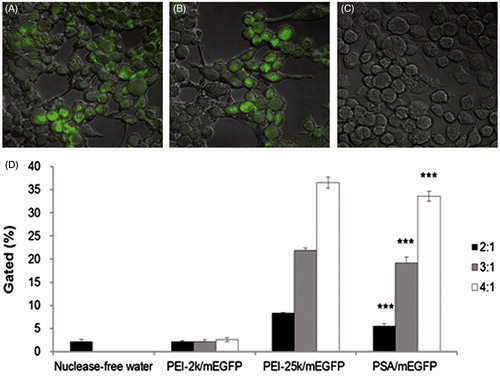
Figure 6. Expression level of co-stimulatory surface markers (CD80 and CD86) in BMDCs treated with naked mRNA alone and complexes. Data are presented as mean ± SD (n = 3), *p < 0.05, ***p < 0.005.
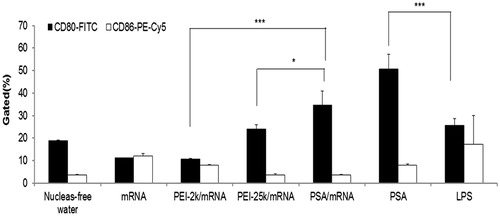
Figure 7. Serum levels of IgG, IgG1 and IgG2a after immunization. Sera from PEI/mGag complexes and naked gag mRNA immunized mice were collected post-immunization. The serum levels of (A) IgG (B) IgG1 and IgG2a antibodies were assayed by ELISA. Both the IgG1 and IgG2a levels in PSA/mGag immunized mice were significantly higher than that of PSA/mRandom, gag mRNA alone and PEI-2k/mGag group (p < 0.05). Data were represented as mean ± SD values (n = 3), *p < 0.05, ***p < 0.005.
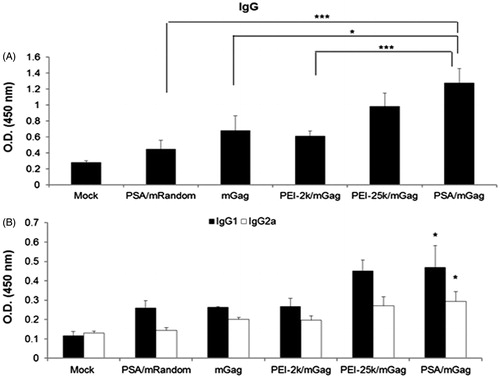
Figure 8. Intracellular cytokine staining of splenocytes after immunized with naked gag mRNA and different PEI/mGag complexes. (A) The CD8+/IFN-γ+ staining, (B) the CD4+/IL-4+ staining, the double-positive percentage of (C) CD8+/IFN-γ+ and (D) CD4+/IL-4+. Data were shown as mean ± SD (n = 3), *p < 0.05, **p < 0.01, ***p < 0.005.
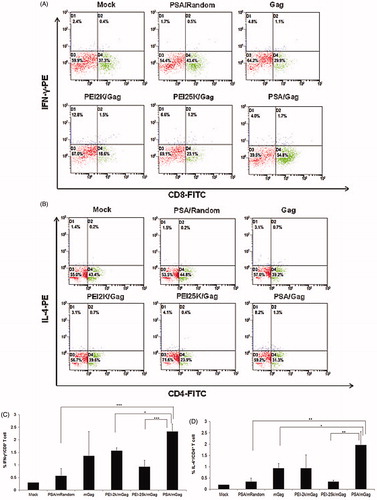
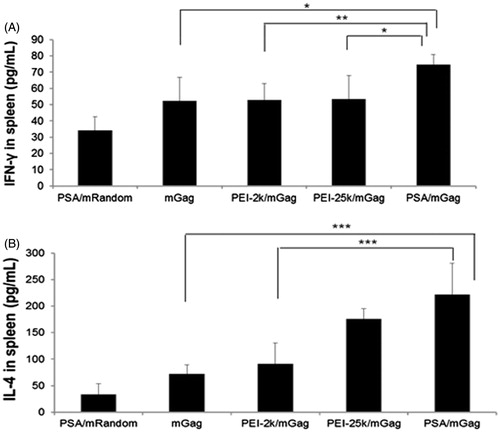
Figure 9. Cytokine production of mice immunized with naked gag mRNA and different complexes. (A) IFN-γ levels in splenocytes supernatants. (B) IL-4 levels in splenocytes supernatants. Data were shown as mean ± SD (n = 4), *p < 0.05, **p < 0.01, ***p < 0.005.