Figures & data
Figure 1. Survival curve of rats with chemically induced hepatocellular carcinoma with or without intravenous administration of OK-Lipo 10 KE. Survival time of the OK-5w group (n = 7) was significantly longer than any other group (p < 0.01; log-rank test).
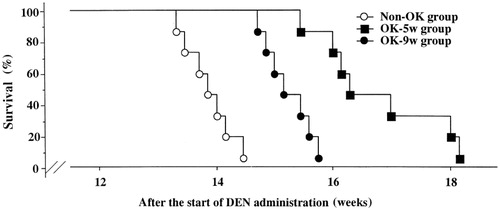
Table 1. Relationship of dose-effect of DHAQ and DHAAQ-PBCA-NS on liver tumor H22.
Figure 2. Scheme of the in-vivo study design. (A) Single-injection model. (B) Repeat injection model. About 3 weeks after the tumor cells injection, HVJ liposomes solution was injected once a week. GCV was injected i.p. once a day for 5 days from the day after each injection of HVJ liposome solution.
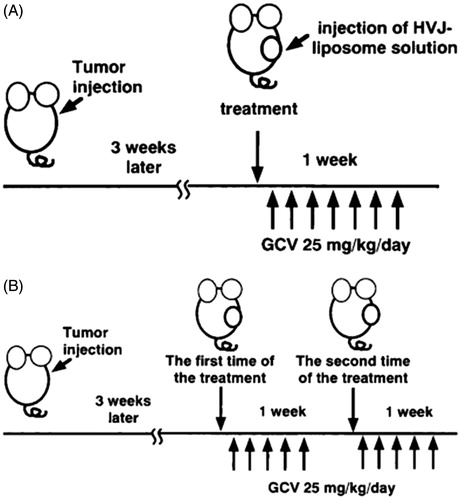
Figure 3. A flowchart for the large-scale acquisition storage and cataloguing of gene traps in mouse ES cell lines.
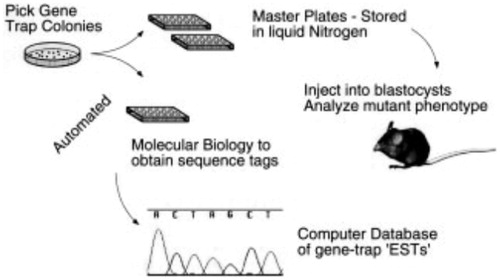
Figure 4. Liver Cd concentration (top) and serum alanine amino transferase levels (bottom) 12 h after Cd administration in C57BL/6J control and MT-null mice.
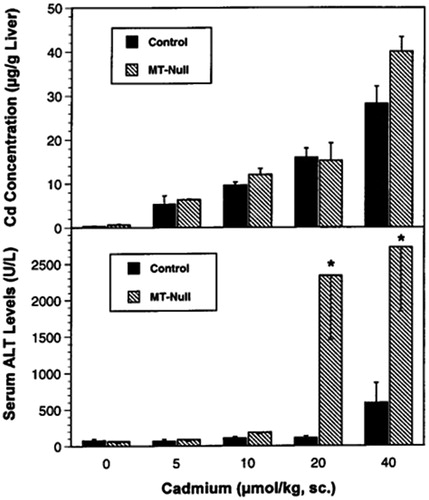
Figure 5. Decrease of dioxin-induced tumor multiplicity in the TNF/IL-1receptors triple null mice. (A) Dioxin-induced liver tumor multiplicity in the DEN-initiated WT and TKO mice. (B) Levels of 7-methylguanine in liver DNA of WT and triple-null (TKO) mice.
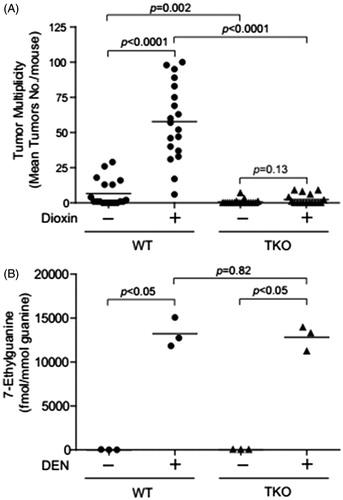
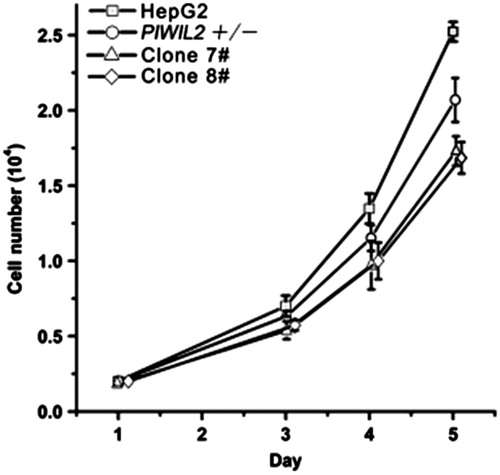
Figure 6. Loss of PIWIL2-reduced HepG2 cell proliferation. Cell proliferation levels of normal HepG2, PIWIL2+/− and PIWIL2 −/− cell lines. Clones #7 and #8 represent the two PIWIL2 knockout cell lines mentioned earlier.