Figures & data
Figure 1. HPLC and ESI-MS spectra of TK (A) and TK-FITC (B).
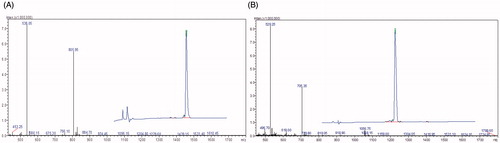
Figure 2. Kinetic analysis of the TK and control (TR) peptide binding to integrin α6β1 by surface plasmon resonance technology. TK and TR peptide at concentrations of 0.625, 1.25, 2.5, 5, 10 and 20 μM.
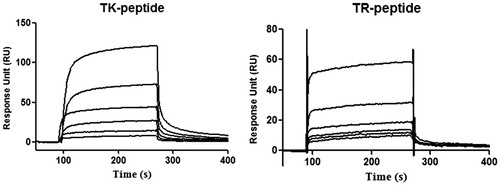
Figure 3. In vitro cellular uptake results of FITC and TK-FITC in Caco-2. Cells were incubated with 5 μM fluorescein-labeled peptide or FITC at 37 °C for 4 h, followed by DAPI staining and rinse with phosphate buffered saline. Intracellular fluorescence was detected by confocal laser scanning microscope (A) and flow cytometer (B).
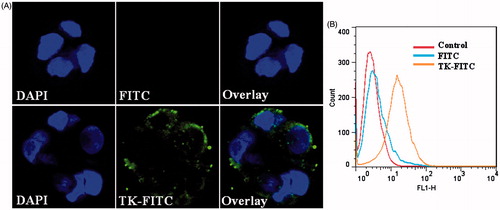
Figure 4. Tumor spheroid uptake of free FITC and TK-FITC peptides. Tumor pheroid were incubated with 5 μM fluorescein-labeled peptide or FITC at 37 °C for 4 h, followed by being examined by confocal microscopy with a 5 μm interval between consecutive slides.
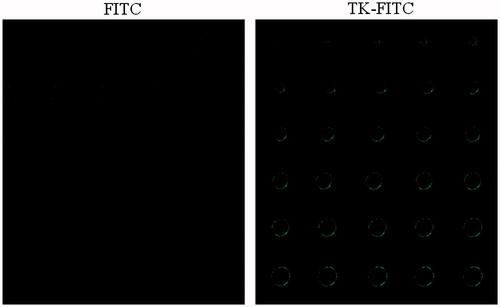
Figure 5. 1H NMR spectra of Mal-PEG-PLA and TK-PEG-PLA in CDCl3. The green circle highlights the characteristic peak of maleimide at 6.7 ppm in mal-PEG-PLA, which disappeared in the spectra of TK-PEG-PLA.
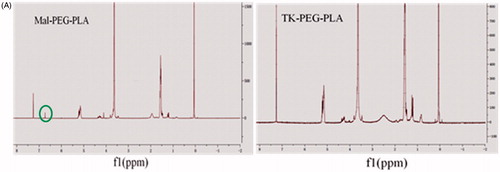
Figure 6. Characterization of micelles. (A) Particle size and distribution of mPEG-PLA and TK-PEG-PLA micelles loading DOX by the DLS analysis. (B) Morphology of mPEG-PLA and TK-PEG-PLA micelles loading DOX by the TEM analysis negatively staining with 4% phosphotungstic acid solution. Bar is 20 nm. (C) In vitro DOX release profiles from blank micelles and TK modified micelles at neutral condition (pH 7.4) and acidic conditions (pH 5.8) at 37 °C. Each points represent the mean (n = 3).
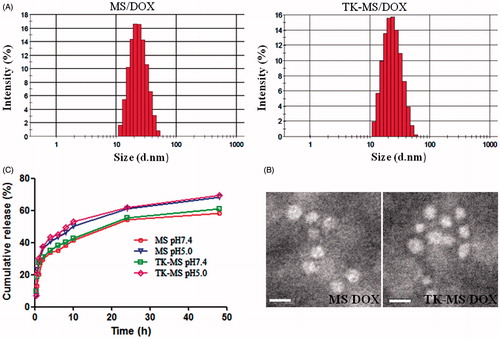
Figure 7. In vitro cellular uptake results of MS and TK-MS in Caco-2. Cells were incubated with 20 ng coumarin-6 loaded in MS or TK-MS at 37 °C for 1 h, followed by DAPI staining and rinse with phosphate buffered saline. Intracellular fluorescence was detected by confocal laser scanning microscope (A) and flow cytometer (B).
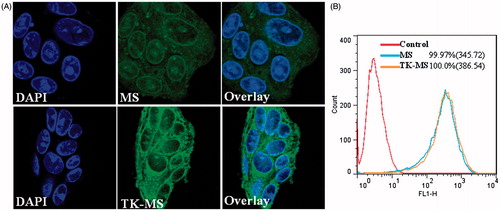
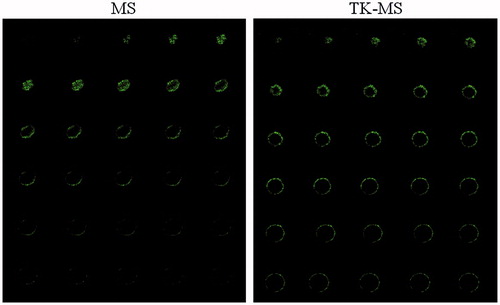
Figure 8. Tumor spheroid penetration of MS and TK-MS. Tumor spheroid were incubated with 20 ng coumarin-6 loaded in MS or TK-MS at 37 °C for 4 h, followed by being examined by confocal microscopy with a 5 μm interval between consecutive slides.