Figures & data
Figure 1. FTIR spectra of (A) Oxaliplatin, (B) Chitosan, (C) Cholesterol, (D) Soyalecithin and (E) DSPE-PEG2000.
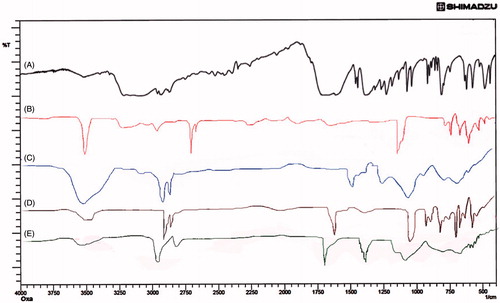
Figure 2. FTIR spectra of (F) Physical mixture (G) OIHNPs (oxaliplatin immuno nanoparticles with antibody coupled by thiol-maleimide conjugation.
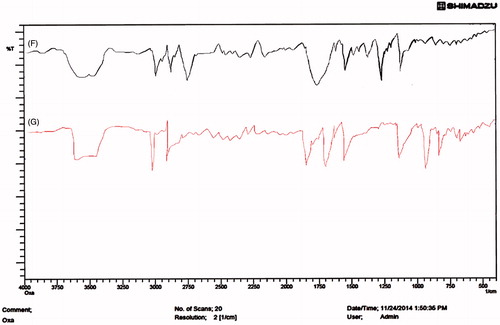
Figure 3. DSC thermograms of (A) Oxaliplatin, (B) DSPE-PEG2000, (C) Chitosan, (D) Cholesterol, (E) Soyalecithin, (F) Physical mixture and (G) OHNPs.
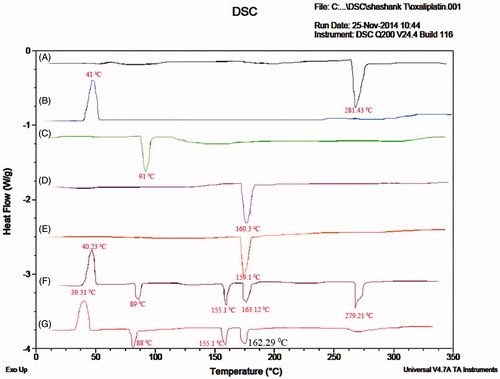
Figure 4. Particle size evaluation of OPNPs by DLS.
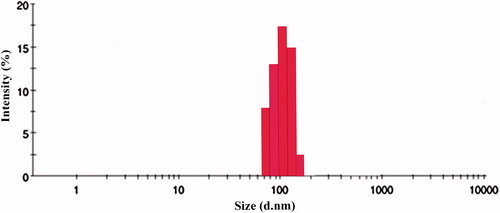
Table 1. Particle size, entrapment efficiency and drug-loading values of different drug: polymer ratios.
Figure 5. Particle size evaluation of OIHNPs by DLS.
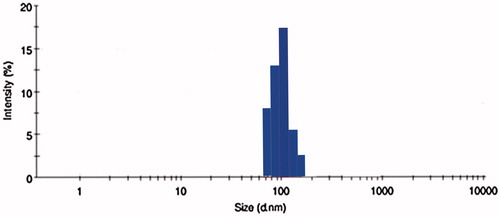
Figure 6. Determination of zetapotential of OIHNPs by Malvern zetasizer.
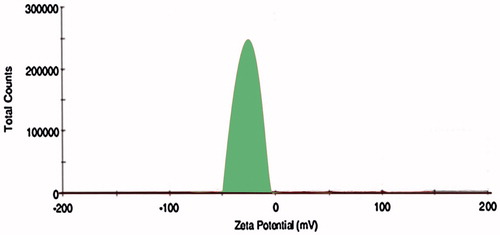
Figure 7. Scanning electron micrographic image of OIHNPs.
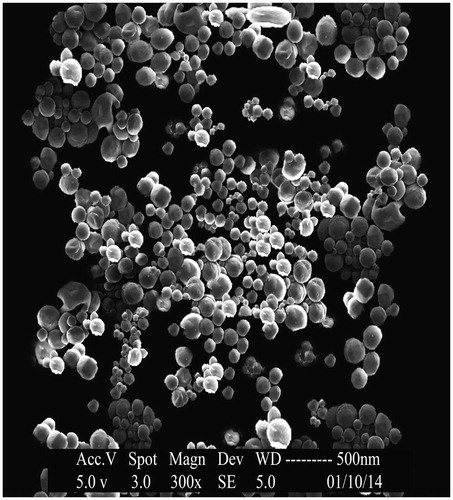
Figure 8. In vitro Cumulative drug release profile of OHNPs.
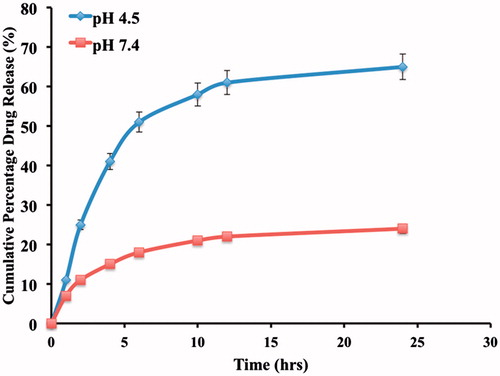
Figure 9. In vitro Cumulative drug release profile of OIHNPs.
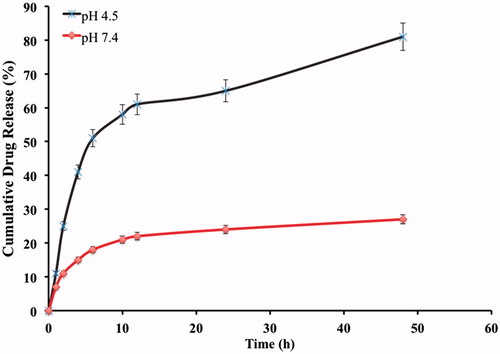
Figure 10. Effect of serum on the size distribution of OPNPs and OIHNPs with time. OIHNPs showed minimal change in size distribution by DLS in serum after 72 h, where as OPNPs showed a significant change in the particle size at 24 and 72 h. Lipid coating around the OIHNPs protects the drug from degradation attributed to their negative surface charge.
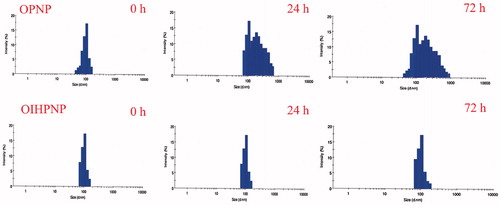
Figure 11. In vitro cell viability of Oxaliplatin, OPNPs, OHNPs and OIHNPS.
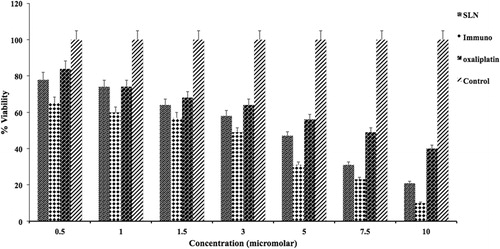
Figure 12. Fluorescent images of hybrid nanoparticles loaded with three fluorescence dyes in cell. In vitro fluorescence images of HT-29 cells (TRAIL-positive) after incubation with OIHNPs-(Nile red)-DAPI-Actin green and OHNPs-(Nile red)-DAPI-Actin green for 1, 3, 5 or 7 h to measure intracellular drug release profiles. Initial first row (vertical) represents nuclei stained with DAPI, which was followed by an second row of actin filaments and third row of nile red nanoparticles that circumvents the nuclei in the fourth row (vertical).
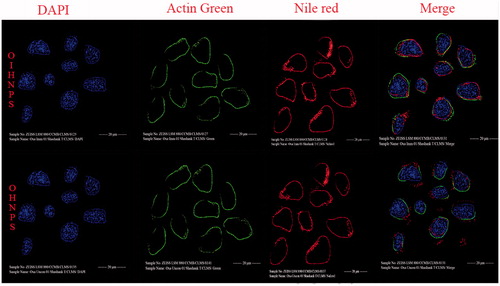
Figure 13. Fluorescent images of hybrid nanoparticles loaded with three fluorescence dyes in cell. In vitro fluorescence images of MCF-7 cells (TRAIL-negative) after incubation with OIHNPs-(Nile red)-DAPI-Actin green and OHNPs-(Nile red)-DAPI-Actin green for 1, 3, 5 or 7 h to measure intracellular drug release profiles. Initial first row (vertical) represents nuclei stained with DAPI, which was followed by an second row of actin filaments and third row of nile red nanoparticles that was present outside the nuclei in the fourth row (vertical).
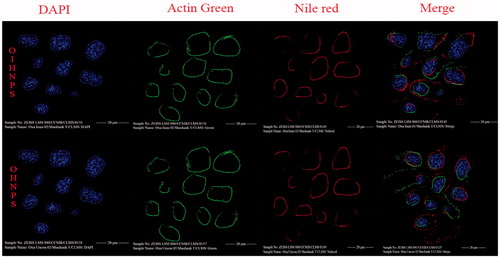
Figure 14. Depletion of mitochondrial membrane potential (ΔΨm) in HT-29 cells induced by OHNPs and OIHNPs. Cells were treated and stained with a mitochondria-selective dye JC-1 and analyzed. Controlled cells produce red fluorescence and green fluorescence (due to the depletion of mitochondrial membrane). Initial row (vertical) represents control that represents intact mitochondria membrane, second row represents partial depletion identified by JC-1 stain where as third row represents complete depletion as can be observed with full change in potential.
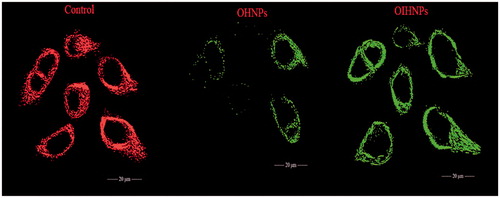
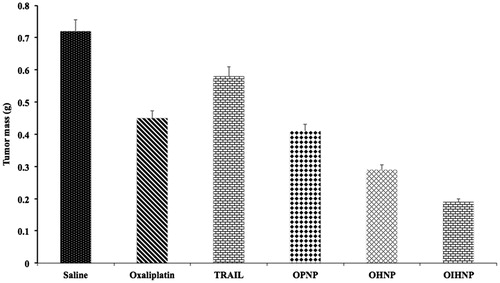
Figure 15. Tumor growth curves with various oxaliplatin formulation treatments (saline, oxaliplatin, TRAIL, OPNP, OHNP, OIHNP). Data are presented as mean ± SD (n = 5), p < 0.05.
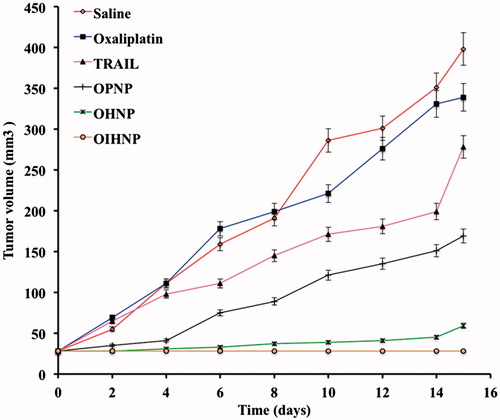
Figure 16. Measurement of tumor weights after excising the tumor xenografts by 15 d (n = 5) tained was due to the depletion of mitochondrial membrane.