Figures & data
Table 1. Composition of GbE proliposomes.
Table 2. The information for MRM parameters used for the flavonoid glycosides and terpene lactones.
Table 3. Characterization of GbE proliposome formulations.
Figure 1. Scanning electron micrographs of proliposome powders (A) formulation II and (B) formulation VI both at ×20 000 maginfication.
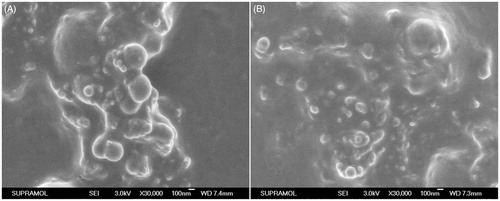
Figure 2. In vitro release profiles of (A) flavonoid glycosides and (B) terpene lactones from proliposome formulations in hydrochloric acid (pH 1.2) and phosphate buffer saline (pH 6.8) (mean ± SD, n = 3).
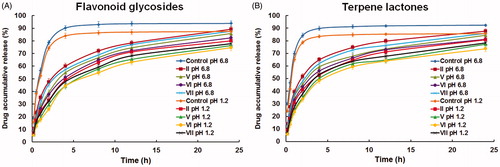
Figure 3. DSC thermograms of (A) GbE, (B) cholesterol, (C) mannitol, (D) physical mixture, (E) proliposome powders (formulation VI).
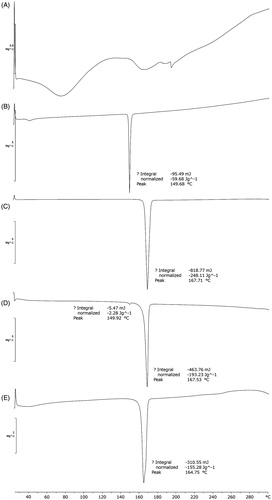
Figure 4. FT-IR spectra of (A) GbE, (B) cholesterol, (C) mannitol, (D) physical mixture, (E) proliposome powders (formulation VI).
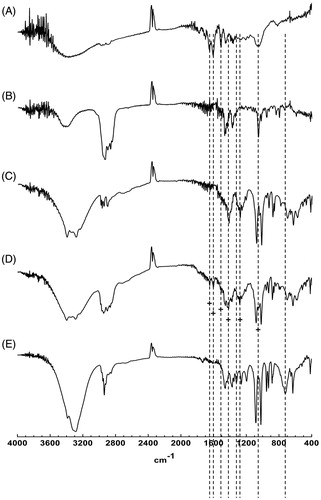
Table 4. In situ intestinal absorption parameters of seven components from control, formulation II and VI, respectively (mean ± SD, n = 3).
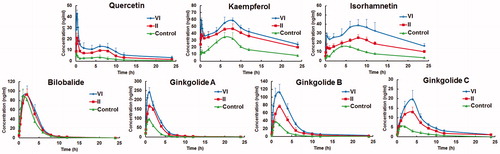
Figure 5. Concentration-time profiles of seven components in rat plasma following oral administration of control, formulation II and VI, respectively (mean ± SD, n = 6).