Figures & data
Figure 1. (A) Synthetic route of HA-adh-DOCA conjugate and HA-adh-GA conjugate. (B) 1H NMR spectra of HA (B1), DOCA (B2), GA (B3), HA-adh-DOCA conjugate (B4) and HA-adh-GA conjugate (B5). (C) DSC profiles of HA-adh-DOCA10 conjugate (C1); silybin (C2); physical mixture of HA-adh-DOCA10 conjugate and silybin (C3); and silybin-loaded HA-adh-DOCA10 micelles (C4). (D) TEM image of silybin-loaded HA-adh-DOCA10 micelles (D1) and silybin-loaded HA-adh-GA20 micelles (D2). The magnification bar denotes 100 nm.
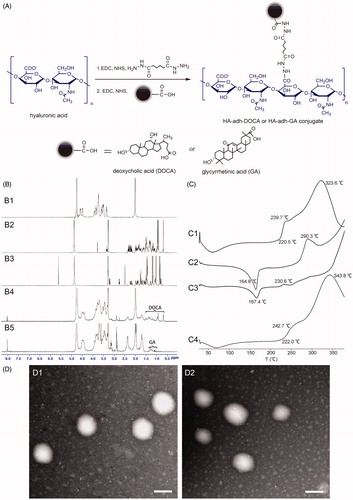
Table 1. Characteristics of silybin-loaded HA-adh-DOCA10 micelles and HA-adh-GA20 micelles.
Table 2. Stability studies of silybin-loaded HA-adh-DOCA10 micelles and HA-adh-GA20 micelles in simulated gastrointestinal fluids and PBS (pH 7.4).
Figure 2. Cumulative released amount of silybin as a function of time in SGF (pH = 1.2, 0–2 h) and SIF (pH = 6.8, 2–48 h) and in PBS (pH = 7.4, 0–48 h). Data are represented as the mean ± S.D. (n = 3).
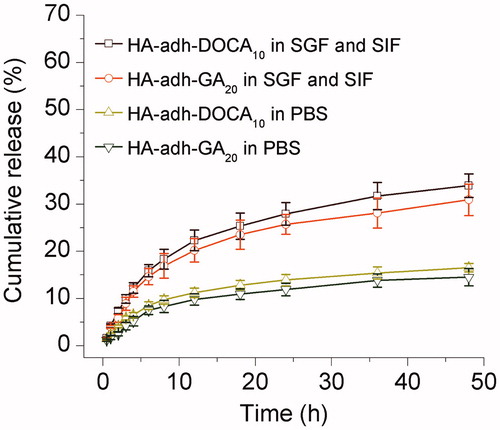
Figure 3. (A) Effective permeability (Peff) of silybin-loaded HA-adh-DOCA10 and HA-adh-GA20 micelles using single-pass intestinal perfusion. (B) Influence of different drug concentrations on the Peff of silybin across rat ileum segment. (C) Plasma concentration-time profiles of silybin after oral administration of silybin suspension, silybin-loaded HA-adh-DOCA10 micelles and silybin-loaded HA-adh-GA20 micelles at a dose of 30 mg/kg to Sprague-Dawley rats. Data are represented as mean ± S.D. (n = 6).
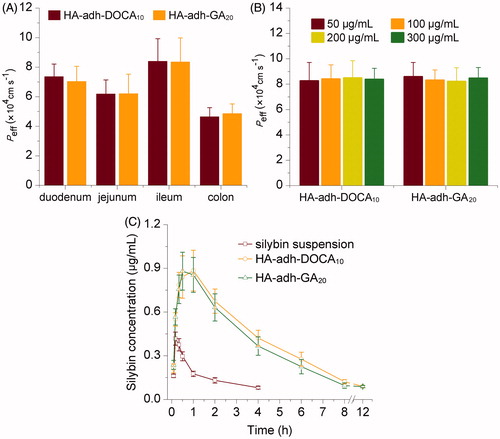
Table 3. Pharmacokinetic parameters of silybin formulations after a single oral dose of 30 mg/kg to Sprague-Dawley rats.
Figure 4. In vivo imaging of ICR mice administrated with DiR-loaded micelles. (A) Images were taken after oral administration of HA-adh-DOCA10 and HA-adh-GA20 micelles at 1 h, 6 h and 12 h, respectively. (B) Ex vivo fluorescence images of tissues collected at 12 h post-administration of HA-adh-DOCA10 and HA-adh-GA20 micelles.
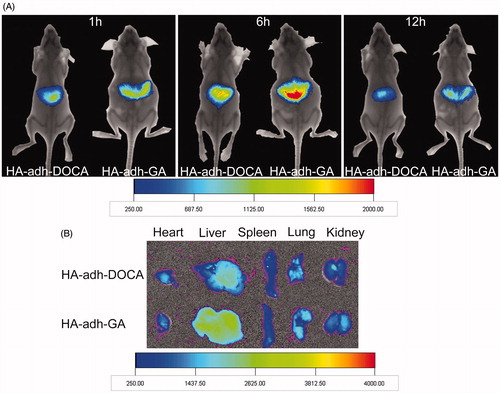
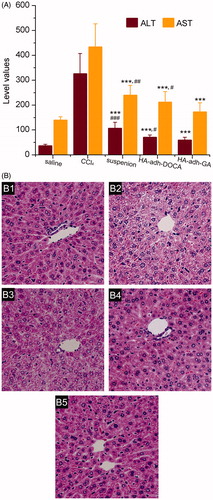
Figure 5. (A) Effects of silybin suspension, silybin-loaded HA-adh-DOCA10 micelles and silybin-loaded HA-adh-GA20 micelles on the AST and ALT activity. Each of the data was presented as mean ± SD (n = 10). ***p < 0.001 versus CCl4 group. #p < 0.05, ##p < 0.01 and ###p < 0.001 versus silybin-loaded HA-adh-GA20 micelles group. (B) Histological analysis of liver slices after treatment of saline (B1, normal control), CCl4 (B2), silybin suspension formulation (B3), silybin-loaded HA-adh-DOCA10 micelles (B4) and silybin-loaded HA-adh-GA20 micelles (B5) by H & E staining. All the images were captured by the Nikon microscope at a 200× magnification of the original images.